
Example: Tracking activities through ad hoc reports
Lucas, a branch manager, needs to regularly track the progress of activities assigned to his branch staff. His team's activity backlog has increased in size over the past two quarters. He wants to get the backlog under control while also ensuring the team's current activities are not affected. To prioritize work assignments and to monitor his team's performance on an ongoing basis, Lucas creates the following reports:
Overdue Tasks
Lucas uses a report shared by another manager as the base for his team's overdue tasks report. After cloning the report and renaming it, Lucas customizes the report, ensuring the following:
The Description, Priority, Due Date, Status, and Assign to fields are selected.
Filters are applied on the Due Date and Status fields so that completed and canceled activities are excluded, and only activities due today or before are included.
The Status field is added as a grouping.
The Column Stacked chart type is selected for the visualization, with the x-axis set to Assign To and with the Status grouping added.
The following video shows how Lucas clones the report, edits it to rename it, adds the missing Priority field, changes the operator for the Due Date filter, excludes completed and canceled activities, adds the grouping, modifies the visualization, and saves it before running it.
Upcoming Activities
To track the activities starting in the next 30 days, Lucas uses the Scheduled activity breakdown report template, which already includes most of the fields he needs in the report. He renames the report, makes the report public, removes the End Time field, and adds the Start Time field. He selects the Add Field as Filter menu option for the Start Time field. He sets the Start Time filter to in the next 30 days and sets the Status filter to exclude canceled activities (completed activities are already excluded in the template). He removes the End Time filter. He adds the Start Time field as a grouping. He selects the Summary tab in the report data pane to show the live feedback when he modifies the Start Time grouping. He sets the Start Time grouping to be done by week. He moves this grouping to the top of the list, so that the summary is broken down by the start time first and can be expanded to view other groupings. He wants the visualization to show activities broken down per user per activity, so he selects Assign To for the x-axis, and adds the Type grouping to the visualization. He retains the Stacked Column chart type, which was preset in the template, and saves the report before running it. He selects the Visualization tab to view the chart, selects the Summary tab in the Report Viewer, and expands some of the items to show resultant groupings.
The following video shows how Lucas creates the upcoming activities report.
Priority Breakdown
Lucas needs to ensure that high-priority activities are completed as scheduled. An at-a-glance view of upcoming activites by priority level would help him keep track of such activities. He clones the Upcoming Activities report that he set up earlier, adding the Priority field. He changes the x-axis to Priority and selects Pie Donut as the chart mode.
Completed Activities
An important performance metric for Lucas' team are completed activities, so he wants to keep track of the total activities completed by each of his team members in the last 90 days. For this, he could use a Completed activities breakdown report template, but since he only needed a simple report with the overall numbers per agent, he decides to create an activity report with just three fields - Assign To, Activity End Time, and Status. He selects the Add Field as Filter menu option for both the Status and Activity End Time fields and sets the filters so that only activities that were "completed" and in the previous 90 days are included. He configures the visualization as a Bar chart with no groupings added and saves the report.
After creating the reports, he proceeds to clone and edit the Activity Management Dashboard, selecting the relevant components from his reports, and reordering and resizing the components as needed. The following image shows an example of a completed dashboard. For more information about cloning a dashboard, see Cloning dashboards.
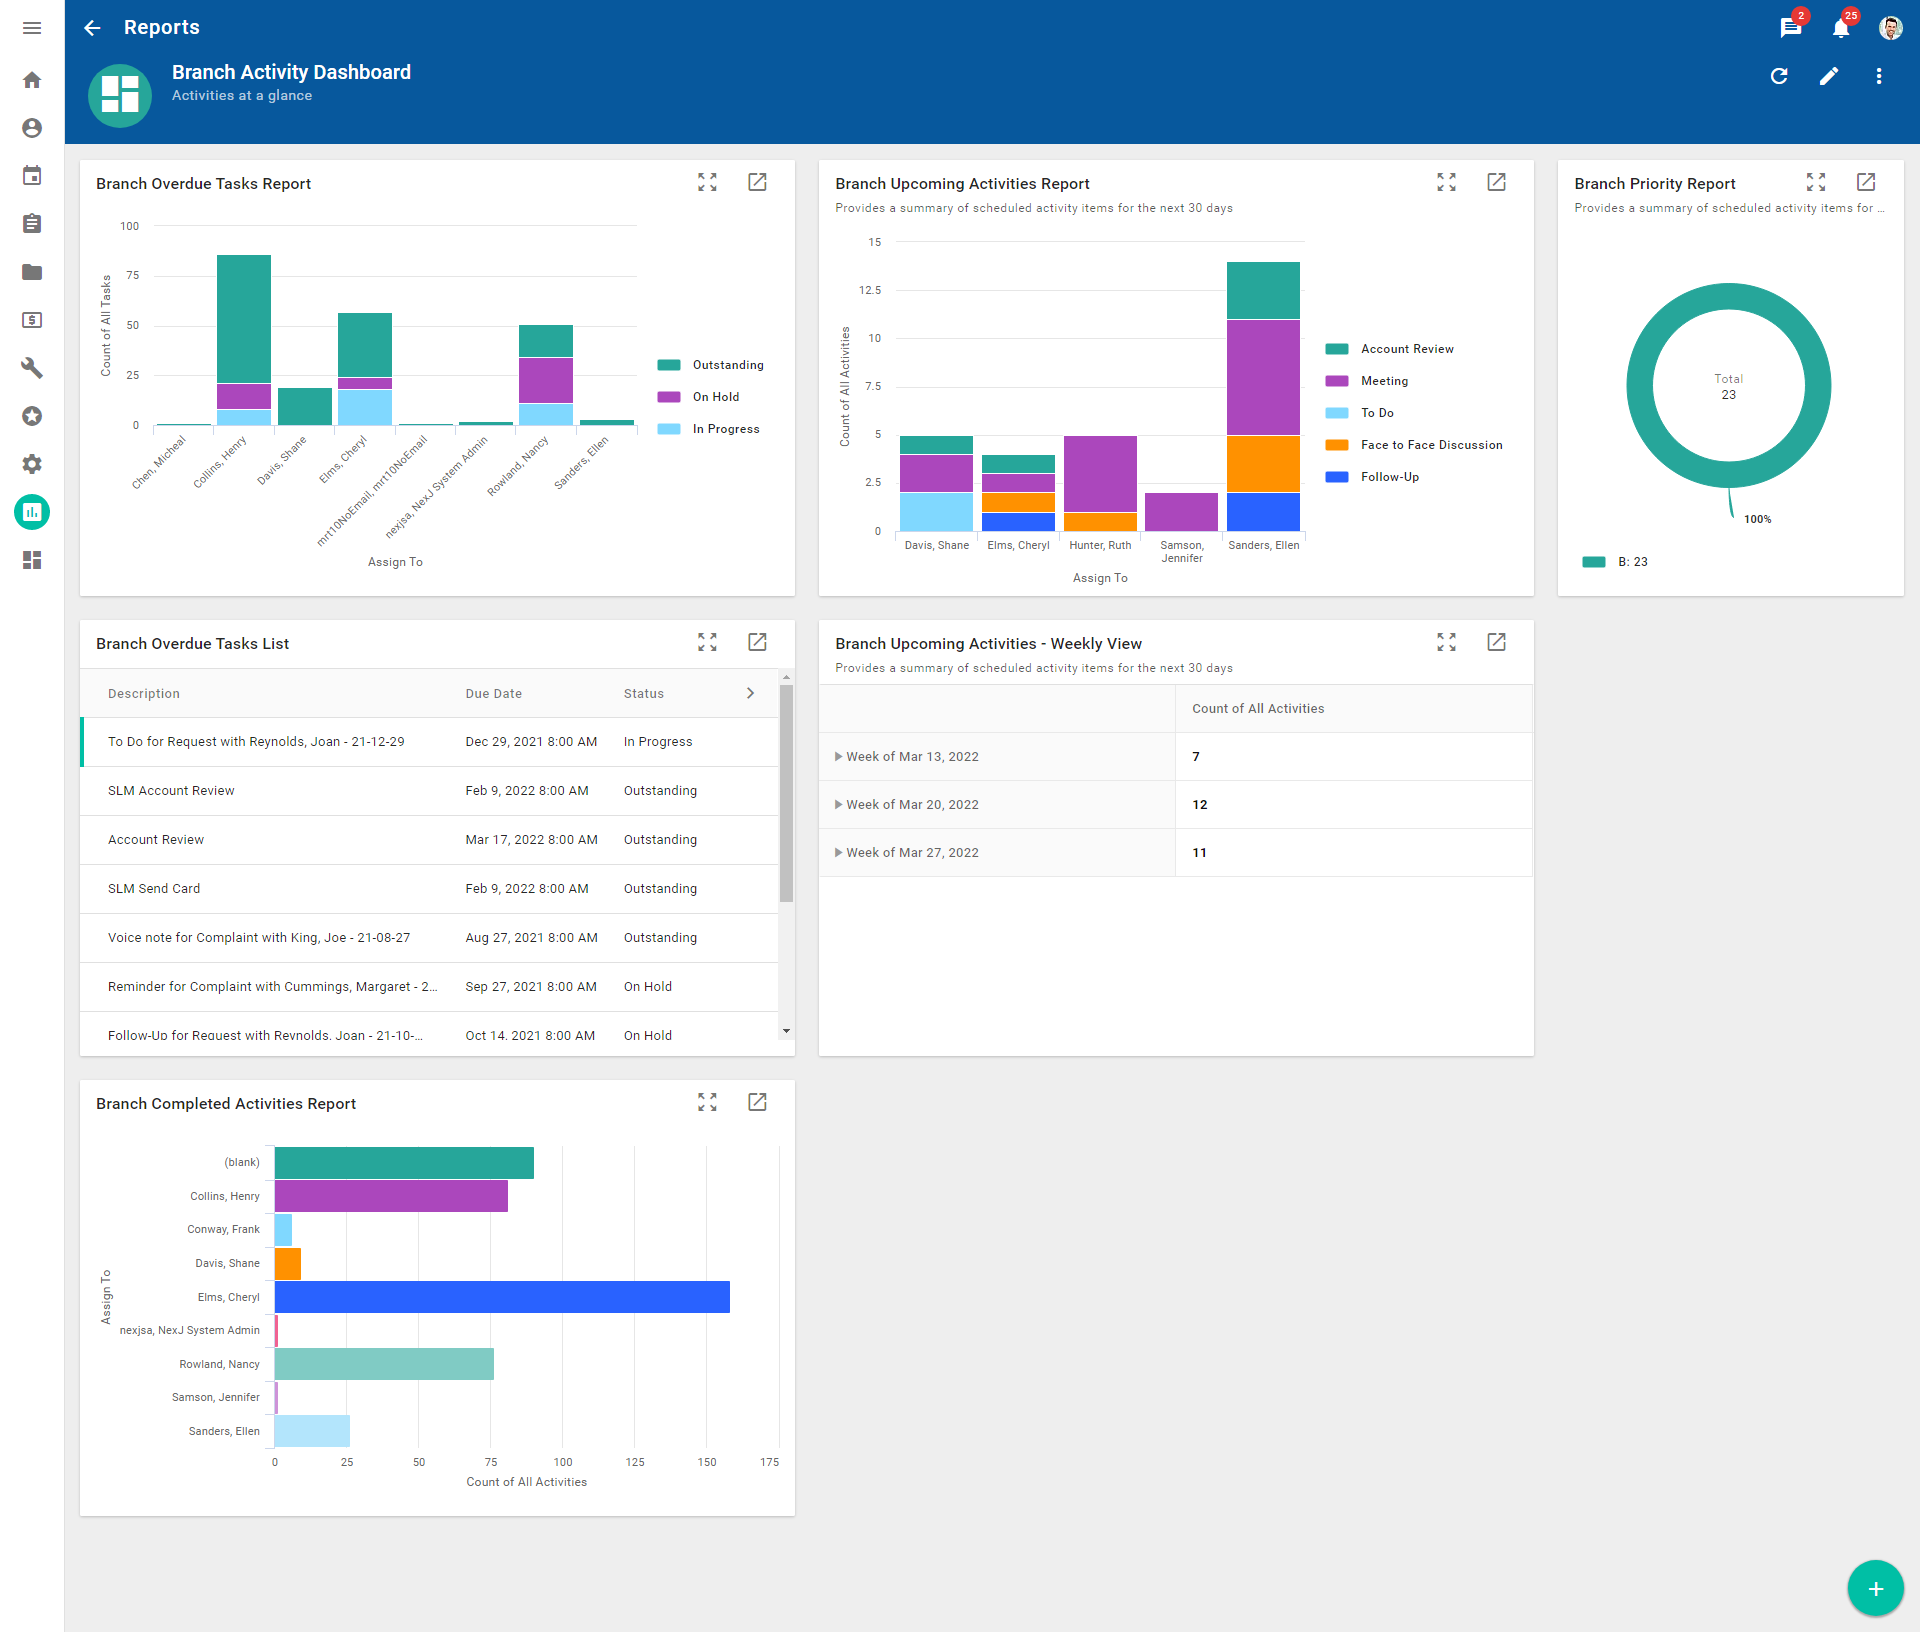
Activity Management Dashboard example