Using Data Bridge
Use Data Bridge to extract data from individual subject areas or to consolidate data from multiple associated subject areas, into a single data view in a custom format. For example, you can create an Opportunities view to include details from the Opportunities subject area, such as description, type, and priority, and also related details from other subject areas, such as related activities.
Views are the cornerstone of NexJ's Data Bridge. Create views of your NexJ CRM data, composed of attributes from your attribute catalog. As of Data Bridge 3.4.0, configure publishing targets, such as delimited files, JSON files, or Apache Kafka topics and define whether updates should be published in a streaming or snapshot manner.
Data views can be created for the following subject areas provided by default:
- Activities
- Addresses
- Attachments
- Call Records
- Categories
- Companies
- Contacts
- Custom Fields
- Deals (product opportunities)
- Documents
- Enumerations
- Households
- Leads
- Opportunities
- Schedule Items
- Service Requests
- Tasks
- Telcoms
TypeLocalizations
- Users
When you create a view, you can choose to:
- Publish a snapshot of the NexJ CRM data as a delimited file, JSON file, or using Kafka. In snapshot mode, all current data in NexJ CRM matching the criteria specified in the view is exported to the data source.
- Continuously stream changes from NexJ CRM to Kafka for the view in real time using the streaming mode.
Navigating the Data Bridge user interface
The following screenshot shows the main application window for Data Bridge, which consists of a navigator sidebar on the left side and a workspace area in the center.
The navigator sidebar enables you to navigate to the View Explorer workspace and the Monitoring Dashboard workspace. To expand the sidebar menu, and see the names of the workspaces, click the collapsed menu button at the top of the sidebar, or click directly on a workspace name to navigate to that workspace.
The Data Bridge UI provides the following:
- The View Explorer displays the views that you created in the views data table. When you create a view, snapshot mode is enabled by default. The Export Count column in the views data table displays the estimated number of records that will be exported when you publish a snapshot for each view. You can perform the following actions from the data table toolbar:
- Click the Add View button in the data table toolbar to add a view on the Create View page.
- Sort records in the data table in ascending or descending order. When you hover over a header of a column that can be used to sort the records, an arrow displays beside the column header. To sort the records in the data table by a sortable column, click the column header. A sorted column displays an up or down arrow beside the header to indicate the sort order. To reverse the sort order, click the column header again. You can also click the Sort by button in the data table toolbar and select a column to sort the displayed results.
- Click the Select columns button in the data table toolbar to choose the columns to display in the data table.
You can do the following in the data table:- Hover over a view to reveal action buttons to:
- Edit the view definition by clicking the Edit View button .
- Delete a selected view by clicking the Delete View button .
- Perform additional actions by clicking the More Actions buttonto:
When snapshot mode is enabled, publish a snapshot of the view by selecting Publish Snapshot and selecting the publishing target (Kafka, File (Delimited), or File (JSON)). A message will display asking you to confirm that you want to export the specified number of records.
The JSON files that are generated from snapshots that use the File (JSON) publishing target have a .json extension and the file encoding uses UTF-8.
Continuously stream changes from NexJ CRM to Kafka for a selected view in real time by selecting Enable Streaming. After you select Enable Streaming, a check mark is added to the Streaming column for the view in the views data table. Select Disable Streaming to temporarily stop streaming changes. For more information, see Performing real-time streaming exports.
The Enable Streaming and Disable Streaming menu options have been temporarily disabled in the View Explorer. It is still possible to enable or disable steaming for a view by editing it, and selecting the Streaming Publishing Enabled checkbox in the Publishing Options tab. No loss of functionality has occurred.
Disable the snapshot mode, by selecting Disable Snapshot. You can re-enable snapshot mode, by selecting Enable Snapshot.
Only views in “Enabled Snapshot” mode can be exported.Export the definition for a selected view by selecting Export Definition.
You can edit or delete views that you created. You can only view, export, or clone views created by other users- Refresh the Export Count column data by selecting Refresh.
- Use the Items per page drop-down to limit the number of items displayed per page.
- Use the chevron buttons to navigate between pages to display additional views.
- As of Data Bridge 3.4.0, you can delete all views at once by selecting the Select all checkbox beside the Name column in the data table, and clicking Delete Views.
- Hover over a view to reveal action buttons to:
- The Monitoring Dashboard enables you to view a high-level summary of streaming near real-time exports performance data and snapshots performance data on a single canvas. For more information, see Monitoring the performance of real-time streaming exports and snapshots.
- The Global Settings workspace enables you to:
- Review CRM connection information, file export information settings, and Kafka server settings that were configured during deployment. For more information, see Using the Global Settings workspace.
- Load model changes (for example, new subject areas) at run time on the Dynamic Metadata Loading card and view the current list of loaded metaclasses on the Loaded Subject Areas card. For more information, see Loading model changes at run time.
- Export CRM metadata as JSON using the CRM Data Bridge Adapter Admin card. For more information, see Using the Global Settings workspace.
View Builder
Use the View Builder to define a view on the Create View page or edit a view. Launch the View Builder by clicking the Add View button in the views data table toolbar or by clicking the Edit View button for an existing view. The View Builder displays a preview of your view's summary and raw data.
The View Builder consists of the following:
- A Create View selection dialog where you can select subject areas, and Blank <Subject Area> View to open the Create View page.
- A Create View page that contains:
- A banner where you can add the views's name and description.
- A view settings pane on the left-hand side with the following tabs:
- Data Selection
Select the required fields and filters for your view. For more information, see Creating views. Publishing Options
Select the required streaming publishing, snapshot publishing, and schedule options, and provide the required Kafka topic name for a view. You can also configure a custom header for publishing event streaming updates to an HTTP URL. For more information, see Creating views.
- Data Selection
- A view data pane on the right-hand side that displays a preview of the raw view data in the Data tab and the message data formatted in JSON in the Message tab. These previews refresh in real time as you modify your view settings. Display additional columns using the chevron buttons . Some collections provide links to associated records on the applicable NexJ CRM workspace. For more information about collections, see Viewing fields of a collection.
You can perform the following actions from the Create view page:
- Save the view by clicking the Save button . The View Details page displays.
- Cancel creation of the report by clicking the Cancel button
View Details
While the View Builder displays a preview of your view data, the View Details page displays the current full data for a selected view. Launch the View Details page by clicking on a view in the views data table.
For more information about the actions you can perform on the View Details page, see Viewing definitions.
View fields
Fields are the basic building blocks for views. Each field represents an attribute that you can include in the view.
You can select fields in the Data Selection tab on the Create View page. Conduct a direct search for fields by entering the field name in the Add Fields text search field, or clicking the Select button for the field, to open the Add Fields dialog, where you can view all available fields and select them. The dialog also includes a text search field. The collections icon identifies a collection that groups related fields. Some collection fields are expandable to display additional fields related to each value of the group. You can include these collection fields in your view and expand them to select additional fields.
If you select a collection field in the Add fields dialog (for example, the Activities field for a Contacts view), and expand the field to select related fields (for example, Activity End Time or Activity Start Time), the view displays the fields of the collection grouped by the subject area (for example, the interactions grouped by contacts). In views, collection fields can be identified by their default fields. The default field is displayed in views to represent the selected collection whether the default field is selected or not (for example, the default field for the Activities collection is the Description field).
Selected fields and default fields of selected collections display as columns in the Data tab in the view data pane. The columns refresh in real time as you add, remove, or modify fields. You can reorder the fields using drag-and-drop in the Fields section in the view settings pane.
After you add a field, you can apply filters to include or exclude specific records from the view. For some fields, multiple selection dialogs are available, where you can select specific values to include or exclude. For other fields, you can use operators, such as equals, contains, greater than, less than, between, unspecified, and so on, to define the filter. For more information about operators supported by Data Bridge, see Using operators.
Viewing definitions
To view the definition for a view, click on the view in the views data table to open the View Details page.
The banner on the View Details page shows the subject area for the view and whether snapshots and streaming exports are enabled or disabled.
When viewing a definition, you can:
- In the History tab, review the status and history information for snapshots and near-real time streaming exports for a view (for more information see Reviewing the status and history for snapshots and Reviewing the status and history for real-time streaming exports).
- In the Preview tab:
- To update the object count, click the Refresh button.
- To retrieve the preview data, and update the Message and Data subtabs, click Load Preview Data.
- In the Data subtab, review the current data for a view. You can sort the data in the columns by ascending or descending order.
Click the links for collections in the Data subtab to view the included fields of the collection together with the default collection field.
Collections can be identified by their default fields in views. The default field is displayed in views to represent the selected collection whether the default field is selected or not (for example, the default field for the Activities collection is the Description field).In the Message subtab, review the output message structure formatted in JSON. If you have selected the Apache Avro message format for snapshot publishing and streaming exports in the Publishing Options tab on the Create View page, you can generate a .json file that contains the Avro schema by clicking Export Avro Schema. For more information about selecting the Avro message format, see Creating views.
- In the Data subtab and Message subtab, you can review the estimated number of records (items) that will be exported for a snapshot before you publish the snapshot. To refresh the number of records, click the Refresh button. The displayed timestamp will also update to show the date and time when you refreshed the number of records.
- In the Errors tab, review the error information for snapshots or real-time streaming exports for a view (for more information see Error handling for snapshots and real-time streaming exports).
- In the About tab, review information for the view that includes: the view's subject area name, the date when the view was last updated, the amount of records, the Kafka topic name and format, selected publishing options, if applicable, the next scheduled run time of the view, and the fields and filters that have been selected for the view definition.
From the View Details page, you can:
- Publish the view to export the data from NexJ CRM to the publishing endpoint (Kafka, delimited file, or JSON file) by clicking the Publish Snapshot button , and selecting Kafka, File (Delimited), or File (JSON).
- Make changes to the view by clicking the Edit button .
- Perform the following actions by clicking the More Actions button and selecting a menu option:
- Export the view's raw data and JSON definition by selecting Export Definition. If you have selected publishing options for the view on the Create View page, these options will also be exported with the JSON definition.
- If you have selected the Avro message format for either or both snapshot publishing and streaming exports on the Create View page, export the Avro schema for the view as a .json file by selecting Export Avro Schema.
Enable streaming or disable streaming exports by selecting Enable Streaming or Disable Streaming.
The Enable Streaming and Disable Streaming menu options have been temporarily disabled in the View Details page for views. It is still possible to enable or disable steaming for a view by editing it, and selecting the Streaming Publishing Enabled checkbox in the Publishing Options tab. No loss of functionality has occurred.
- Enable or disable snapshots by selecting Enable Snapshot or Disable Snapshot.
For more information about how to perform these tasks, see View fields, Modifying views, and Exporting view definitions.
Viewing fields of a collection
On the Create View page, and in the Data subtab, the collections icon indicates that the field is a collection. Click on the icon to see the fields of the collection that you added to the view. To add more fields from a collection to a view, you must add the fields to the view in the Add Fields dialog for the view.
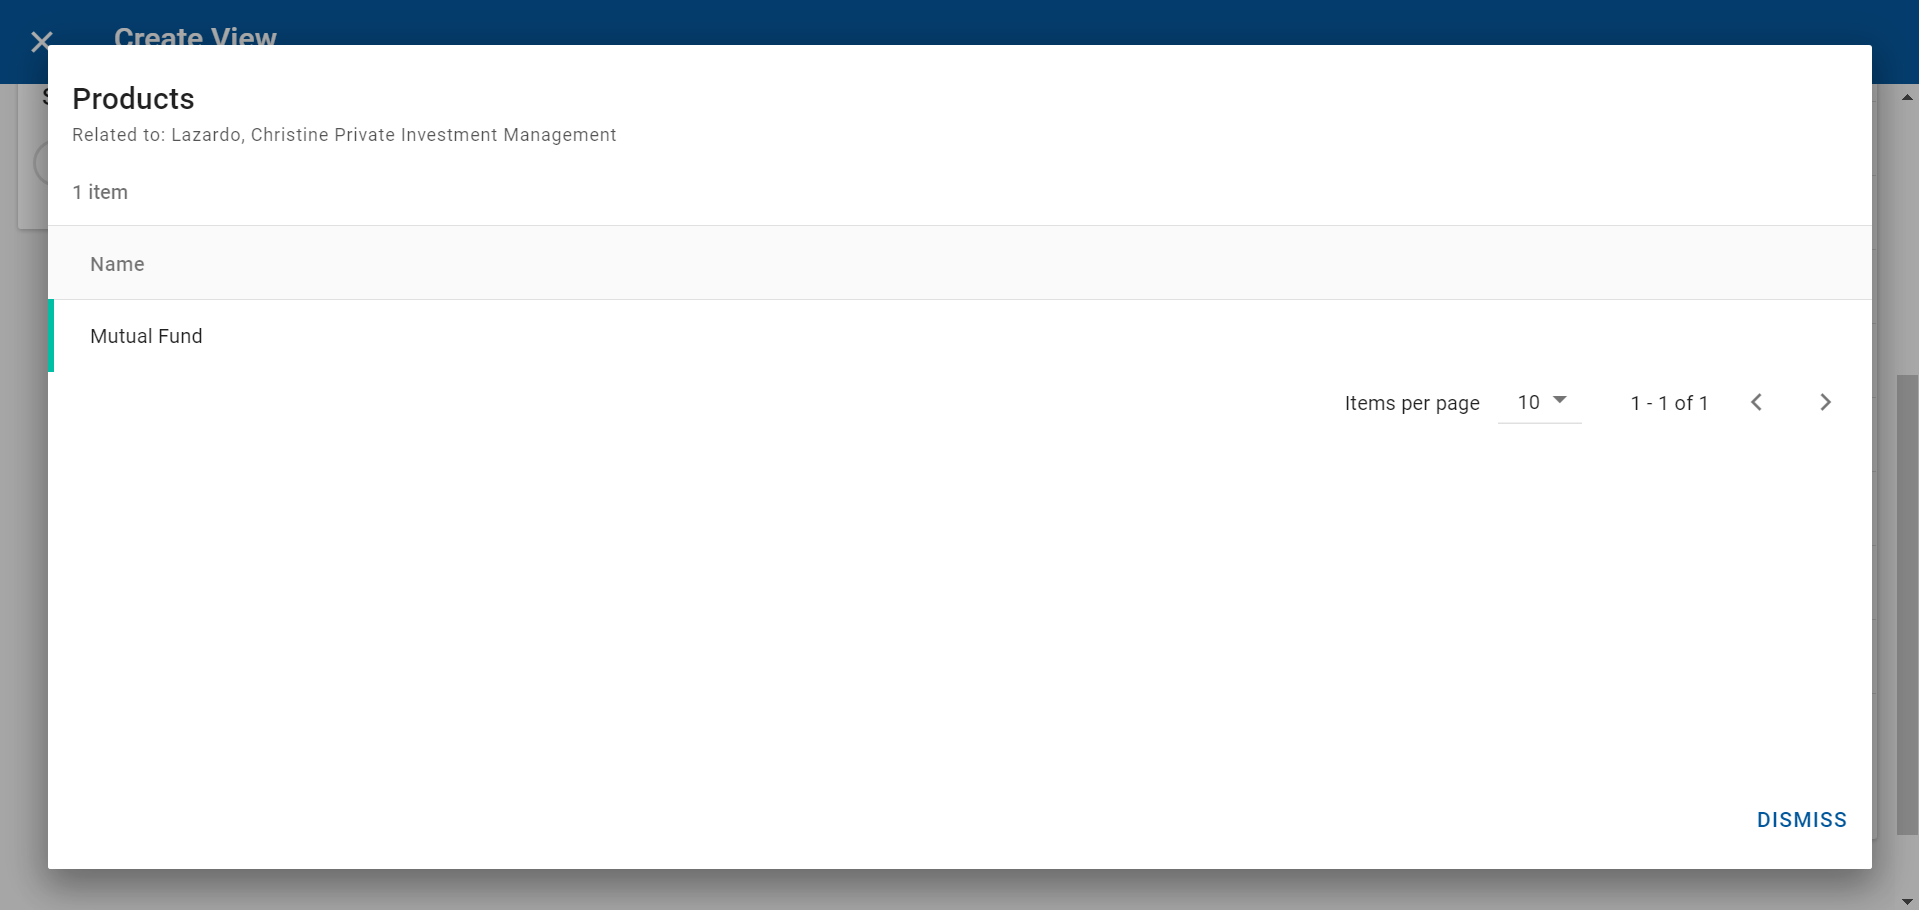
When a Products collection is included in a view, you can click a collection name link in the Data subtab to view which contact the collection is associated with, and which products, and the default field for the collection, which is Name. The following screenshot shows the dialog that displays when you click a link of the collection name. In this example, the contact has one product, which displays in the Products data table.
Creating views
The View Builder takes you through the steps needed to create a view. Select the fields you want to view and add any filters to limit the view data.
You can either create a view or import one or more JSON files containing view definitions to view or edit as needed.
To create a view:
- In the View Explorer, click the Add View button at the top right of the views data table.
- Choose the subject area you want to generate a view for.
- Do one of the following:
To build your view from scratch, select Blank <Subject Area> View to open the Create View page.
- To import one or more JSON files containing view definitions, click the Select button next to Import View Definitions from JSON, select the file (or files), and click Open. If you previously exported a view definition with publishing options selected for the view on the Create View page, these options are retained and are imported with the view definition.
- If you imported a JSON file (or files), the view data is populated immediately. Skip the remaining steps in this procedure and edit the view parameters as needed. For more information, see Modifying views.
Enter a meaningful name for the view, and, optionally, provide a description.
On the Create View page in the Data Selection tab, and in the Fields section, click the Select button, and select fields from the following tabs:
Basic tab:
In this tab, you can select attributes and calculated attributes that are persisted to the database. Calculated attributes are identified using theicon.Advanced tab:
In this tab, you can select attributes that are available in the Basic tab, attibutes that are not persisted to the database, and calculated attributes that are or are not persisted to the database. Non-persistent attributes are identified using the icon.To display more information about an attribute in the Basic or Advanced tabs, hover over the icon for the attribute to display its name and type. To display more information about a collection, hover over the the icon to display its name, type, and name attribute information.
If you know the names of the fields you want to add, you can directly enter the field name in the Add Fields text search field. A similar search field is available within the Add Fields dialog. For more information about searching for fields, see View fields.
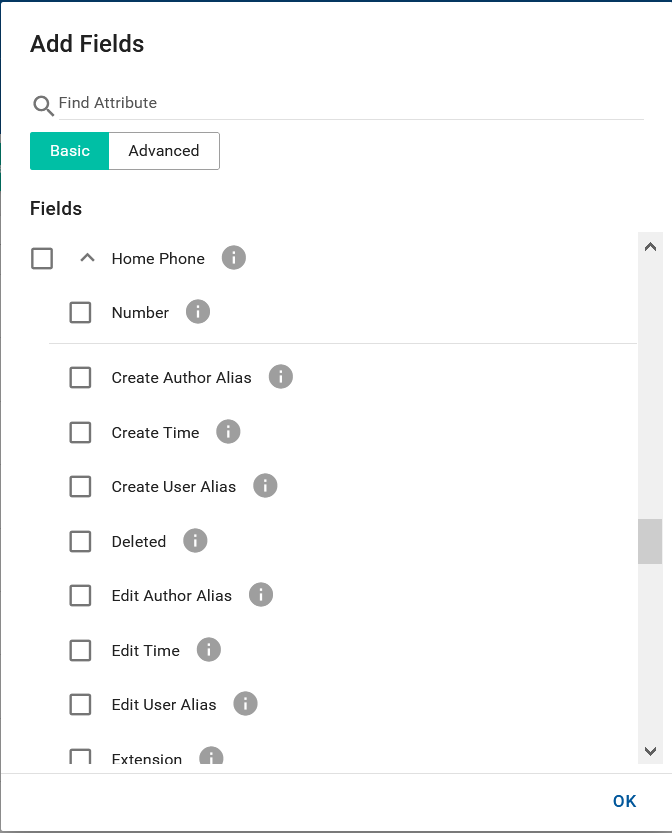
Some primary subject area fields have associated fields that are available for selection. For example, if you are creating a view definition for the Contacts subject area, you can expand the Home Phone field to select associated fields and display additional data in the preview data table, as shown in the following screenshot:
Optional: In the Filters section, select the filters you want to apply to refine your view data:
Filtering for persistent attributes is supported but filtering for non-persistent attributes is not currently supported.
Click the Select button to open the Add filters dialog and select the required filters. To display more information about an attribute that can be selected as a filter, hover over the icon for the attribute to display its name and type.
If you choose to select filters that use Character Large Object (CLOB) data type attributes (for example, by selecting Activities > Notes as a filter), you may experience reduced snapshot publishing performance.
In the Enter filter dialog, do one of the following:
If you see a list of values you can select from, select the values you want to include.
If you see fields for an operator and a text or numeric field value, select the operator and specify the values. For more information, see Using operators.
Available operators vary based on the attribute type.
- Click Save.
The fields to which you applied filters are highlighted in green.
- Optional: Select from the following options in the Publishing Options tab:
- Streaming Configuration
Enable or disable streaming publishing by selecting or clearing Streaming Publishing Enabled. You can select a streaming target of either HTTP or Kafka. Snapshot Configuration
Enable or disable snapshot publishing by selecting or clearing Snapshot Publishing Enabled.Before you can select snapshot Schedule options, Snapshot Publishing Enabled must be selected.When a user deletes a major NexJ CRM object (such as an entity or activity) from the NexJ CRM user interface, it is considered to have a soft-deleted record, as the record remains in the database. You can enable or disable the output of soft-deleted records as part of snapshots by selecting or clearing Include deleted records.
Select which records will be published when you publish a snapshot for the publishing endpoints by selecting from the following options:- All records
Publishes all field records in the system that apply to your view definition. Changes (primary fields)
Publishes only primary subject area field records (for example, contact records for the Contacts subject area) that have been added or updated since the last time a snapshot was published for this view.For example, if a user changes a contact's first name in NexJ CRM, and you create a view definition for the Contacts subject area that includes the First Name field, and select Changes (primary fields), the first name change will be exported as part of a delta snapshot. If a user has changed an associated field (for example, the contact's phone number), and you create a view definition that includes the Number associated field for the Home Phone field, the record for the associated field will not be published with the delta snapshot.Changes (primary or associated fields)
Publishes primary subject area field records (for example, contact records for the Contacts subject area) and their associated fields records (for example, a contact's phone number or address), when the associated field records have been added or updated since the last time a snapshot was published.For example, if a user changes a contact's first name and the city for the contact's home address in NexJ CRM, and you create a view definition for the Contacts subject area that includes the First Name field, and the City associated field for the Home Address field, and select Changes (primary or associated fields), the records for the changed first name and city will be published with the delta snapshot.
If your view definition does not include associated fields, then user updates to associated fields will not be exported
You can set up the snapshot schedule in the snapshot Schedule section. The default frequency is None, which runs the snapshot immediately. If you want a snapshot to publish only once, but at a future time, select Once, and specify the desired date and time. If you want it to run periodically, select Daily, Weekly, or Monthly, and specify the start date and time. The snapshot runs for the first time at the start date and time, and will continue running periodically as specified in the schedule. Select either Kafka, File (Delimited), or File (JSON) as your publishing target.
The About tab on the View Details page shows the next scheduled run time for the snapshot.
If a snapshot fails to run at the scheduled time, an error displays in the Errors tab for the view. If you see an error, try re-running the snapshot. This may resolve any failures due to temporary server issues. If it is a recurring scheduled snapshot, the system will reattempt to run the snapshot at the next scheduled time. If the issue persists, contact your administrator with the error code.
- All records
Kafka Configuration
You can provide a Kafka topic name for the view in the Topic name field. The Kafka topic name is displayed in the About tab for the view.You can use the same Kafka topic name for multiple views.
When providing a topic name, you should be aware of the following rules:
- Topic names cannot exceed 209 characters
- Valid characters include a - z, A - Z , 0 - 9, period ("."), underscore ("_"), and hyphen ("-")
- The topic name cannot just be a period (".") or ".."
- Use either a period (".") or underscore ("_") but not both to avoid collision issues
You can choose either the JSON message format or the Avro message format to use with Kafka for snapshot publishing and streaming exports.
As of Data Bridge 3.3.0.1, you can also specify the Kafka namespace and schema name. Both namespaces and schema names can only start with an alphabetical character. Use the following characters when specifying them:- For namespaces, use a - z, A - Z , 0 - 9, "." or "_" (not both of them)
For schema names, use a - z, A - Z , 0 - 9, "_"
- HTTP Configuration
You can publish event streaming updates to an HTTP URL instead of Kafka by completing the following fields:- HTTP URL: Enter the URL that will receive the event streaming updates (for example,
http://<host>/channel/brg:HTTPReceiver?). This URL will be used for both streaming and snapshot publishing. - HTTP Sender Channel: Enter the HTTP channel that will be used to send messages to the HTTP URL (for example,
brg:HTTPSender). You can use an out-of-the-box HTTP channel or create your own channel. You must specify the channel in your environment file. For more information, see Data Bridge 3.6.x deployment. - HTTP Custom Header: (Optional) You can enter a custom header that provides additional information (for example, enter
secretfor an API to call a web hook). When specified, the custom header will be added to every outgoing HTTP request for the view. For more information about custom headers, see Creating custom headers for HTTP targets. - HTTP Custom Header Class: (Optional) You can enter the name for the class you created at design time (for example,
brg:CustomHTTPHeader). - HTTP Custom Header Event: (Optional) You can enter the event name you created at design time (for example,
getXhookKey). - HTTP Custom Header Value: (Optional) You can enter a header value (for example,
ad67e009). If you have already entered an HTTP custom header class, the class will take precedence over the header value you have entered.
- HTTP URL: Enter the URL that will receive the event streaming updates (for example,
- Streaming Configuration
- Click the Save button
You can configure multiple views to participate in a shared virtual schema by providing the same topic name, schema name, and schema namespace values for the views. A shared schema consists of a combination of all the attributes defined in the participating views, and that schema will be applied when publishing snapshots to JSON files, and publishing streaming updates to Kafka when you have selected the JSON or Avro message formats in the Publishing Options tab. When exported, any attribute in a shared schema but not in a view will export as "null."
If any of the following attributes is unique to a view, the schema is considered unique and not shared:
- topic name
- schema name
- schema namespace
Using operators
Data Bridge provides the following operators in the Filters section for views:
| Operator | Description | Types of fields |
|---|---|---|
| equals | Search for records with an exact match for the specified field value(s). If the field(s) have a defined list of possible values then you can select one or more from the available items. If the field(s) do not have a defined list of values then the equals operator searches for the exact text that you enter or the exact date you select. |
|
| not equals | Search for records where the specified value(s) does not match the value of the specified field(s). If the field(s) have a defined list of values, then you can select one or more options from the available list. If the field(s) do not have a defined list of values, then the not equals operator searches for records that do not match the exact text that you enter or the exact date you select. Search results with a not equals operator do not include records for which the attribute is not set. |
|
| specified | Search for records that have a value specified for the field. |
|
| unspecified | Search for records that do not have a value specified for the field. |
|
less than | Search for records in which the value of the specified field is less than the value you specify in your search. |
|
less than or equal to | Search for records in which the value of the specified field is less than or equal to the value you specify in your search. |
|
| greater than | Search for records in which the value of the specified field is greater than the value you specify in your search. |
|
| greater than or equal to | Search for records in which the value of the specified field is greater than or equal to the value you specify in your search. |
|
| contains | Search for records in which the value that you specified matches the whole or part of the value for the specified field. |
|
does not contain | Search for records in which the value that you specified does not match any part of the value for the specified field. |
|
| between | Search for records in which the value for the specified field is between the Lower bound and Upper bound field values that you specify. For a numerical field the search results include records with values that match the lower and upper bound values. For a date field the search results include records with values that match the lower bound value, but do not include records that match the upper bound value. |
|
| equals today | Search for records in which the value for the specified field is today's date, including the year. | Date |
| in the previous (days) | Search for records in which the value for the specified date field is a date in the past within the specified number of calendar days. For example, if you select the in the previous (days) operator and specify two days in the Days field, the search results include records for yesterday and the day before yesterday. | Date |
| in the next (days) | Search for records in which the value for the specified date field is a date in the future within the specified number of calendar days. For example, if you select the in the next (days) operator and specify two days in the Days field, the search results include records for tomorrow, and the day after tomorrow. | Date |
| today or before | Search for records in which the value for the specified date field is either today's date or a date that has past. | Date |
| today or after | Search for records in which the value for the specified date field is either today's date or a future date. | Date |
Modifying views
You can modify your views by:
- In the views data table, hovering over the view and clicking the Edit View button .
- After you have saved a view, clicking the Edit button .
You can make the following changes to a view:
| Modification | How to modify |
|---|---|
| Edit view name | In the view banner, enter the new Name. |
| Add or edit view description | In the view banner, enter or edit the Description. |
| Add fields | In the Fields section, click the Select button . You can also use the Add Fields text search field to search for specific fields and add them to your view. |
| Remove fields | In the Fields section, click the Clear button on the field you want to remove. |
| Reorder view columns | In the Fields section, drag and drop the fields to the desired position. |
| Apply filters on fields | In the Filters section, click a field, and select the filter values. For some fields, you will need to select an operator and specify the values to work in conjunction with it. |
| Edit filters | In the Filters section, click a filtered field, and edit the filter selection. |
| Remove filters | In the Filters section, click the Clear button on the field you want to remove the filter from. |
| Clear all filters | In the Filters section, click the Clear Filters button . |
After making your changes, click the Save button . This executes the view so the tabs reflect the latest NexJ CRM data.
Performing real-time streaming exports
You can perform streaming near real-time exports that send the latest full copies of CRM data objects matching the view criteria to the Kafka endpoint as the data is being generated in NexJ CRM.
To perform real-time streaming exports, in the views data table click the More Actions buttonfor a selected view, and select Enable Streaming. When CRM data that matches the view criteria is added, changed, or deleted, Data Bridge will send a message to the specified Kafka topic. Each message sent to Kafka includes a timestamp indicating the time when the information was retrieved from CRM. The timestamp should be used by applications consuming CRM updates as a means to determine the latest version of the data.
If you create a view for a subject area that is a parent class (for example, you create a view for the Activities subject area, which is the parent class for the Documents, Tasks, Activity Plans, Call Records, and Schedule Items subclasses), changes made to the subclass objects (for example, Schedule Item objects) in NexJ CRM are captured by the parent class-based view and are included in real-time streaming updates.
Publishing snapshots
You can publish a snapshot of a view to push the existing data from NexJ CRM to the Kafa, delimited file, or JSON file publishing endpoints once. Select the required view in the views data table, click the More Actions button, select Publish Snapshot, and select from the following options:
- Kafka
- File (Delimited)
- File (JSON)
- HTTP
A message will display asking you to confirm that you want to export the specified number of records. You can also publish the snapshot from the View Details page.
As of Data Bridge 3.4.1, when a File (JSON) or File (Delimited) snapshot is published, the output extract files are written to a directory specified in an environment file (for example, DataBridge_Extracts). If only one extract file is created by the snapshot it will be written directly to the specified directory (for example, DataBridge_Extracts/filename.extension). If more than one extract file is created by the snapshot it will be written to a subdirectory below the specified directory created for the individual snapshot (for example, DataBridge_Extracts/SnapShotName/filename.extension).
When date and time attributes are exported for any publishing endpoint, their values are translated into Coordinated Universal Time (UTC) standard format.
As of Data Bridge 3.4.1, when you publish a File (Delimited) or File (JSON) snapshot for a view, a MANIFEST file is created to provide you with a list of the output extract files that are included in the snapshot, and to notify you that the snapshot has been published. For more information about MANIFEST files, see Output format specifications.
Exporting view definitions
You can export a views's definition in JSON format for the purpose of reusing it in another environment. Select the required view in the views data table, click the More Actions button, and select Export Definition. You can also export view definitions from the View Details page. The file is downloaded to your local .../Downloads folder in JSON format. The default file name is in the following format: <viewName>.json. The column order in the file is the same as when viewing the view.
Reviewing the status and history for snapshots
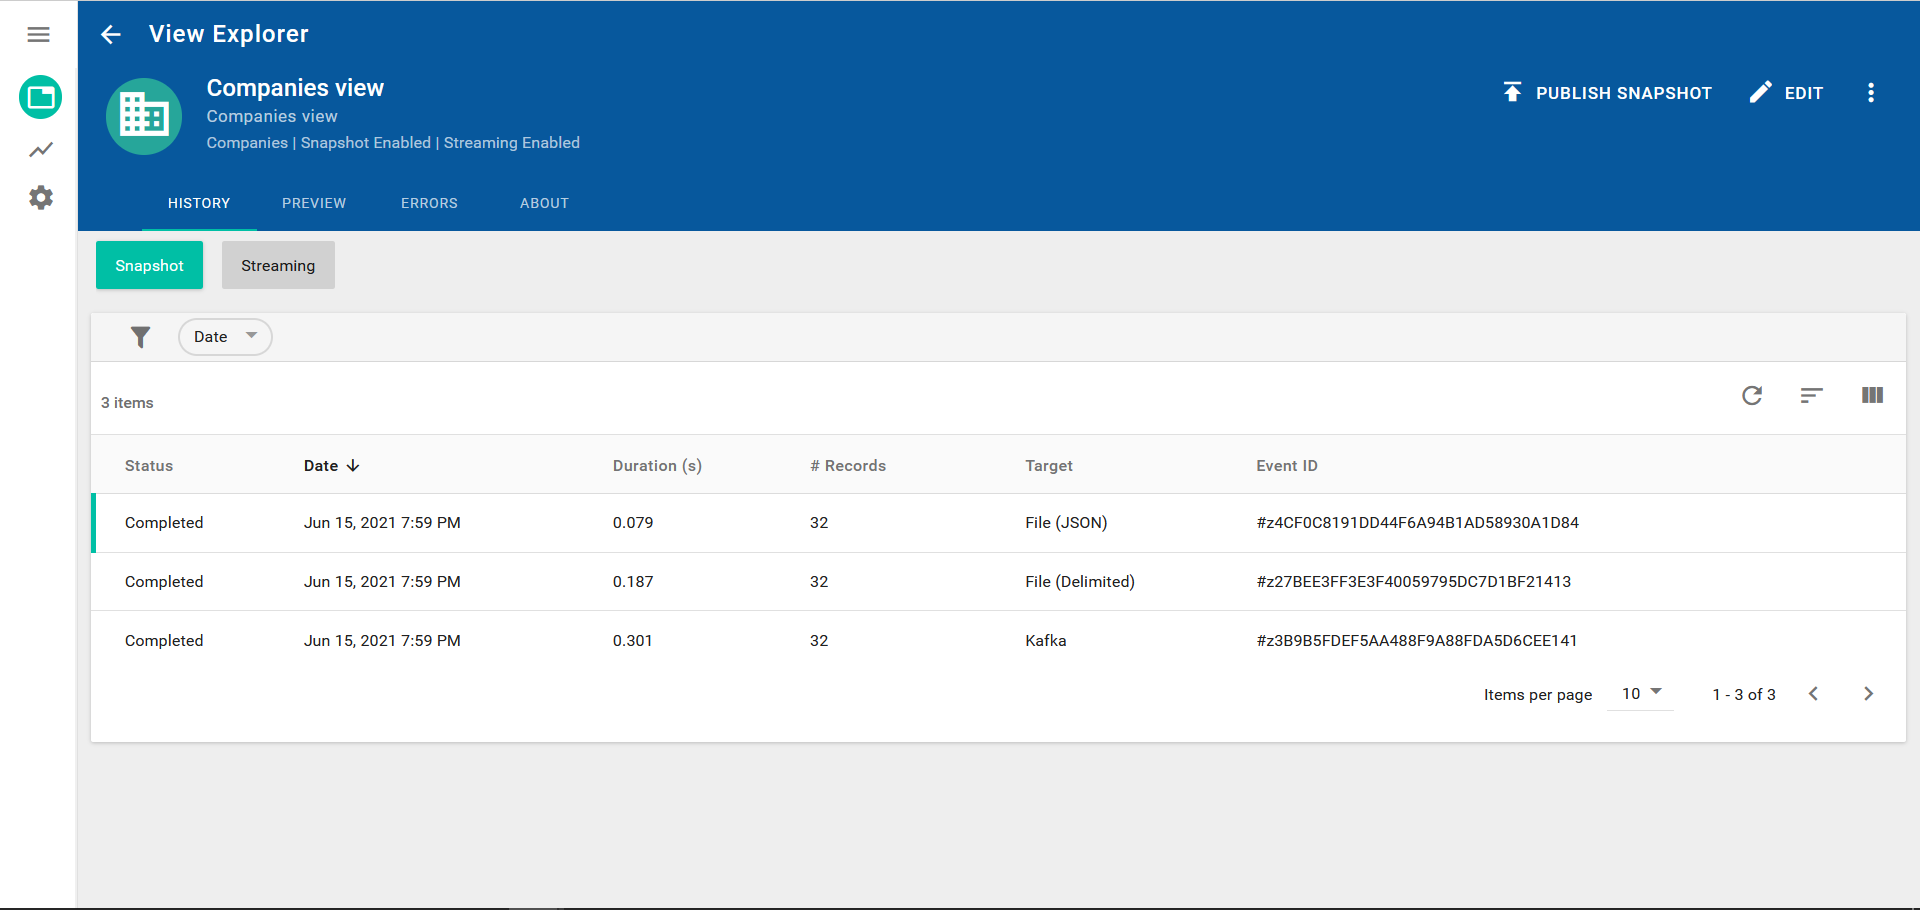
To review the status and history information for snapshots, select the History tab and Snapshot subtab for the view on the View Details page, which is shown in the following screenshot.
The snapshot history data table contains the following columns:
- Status - displays one of the following statuses for each snapshot:
- In Progress
- In Progress with errors
- Cancelling
- Cancelled by user
- Completed
- Completed with errors
- Date - the date when you started the snapshot. You can sort the Date column in ascending or descending order by clicking on the arrow button.
- Duration (s) - the time (in seconds) it took for the snapshot
- # Records - the total number of records exported to the publishing endpoint
- Target - the publishing endpoint
- Event ID - a unique identifier for the snapshot
You can select the Date filter chip and define search criteria to filter the history data table based on the date when you started the snapshot.
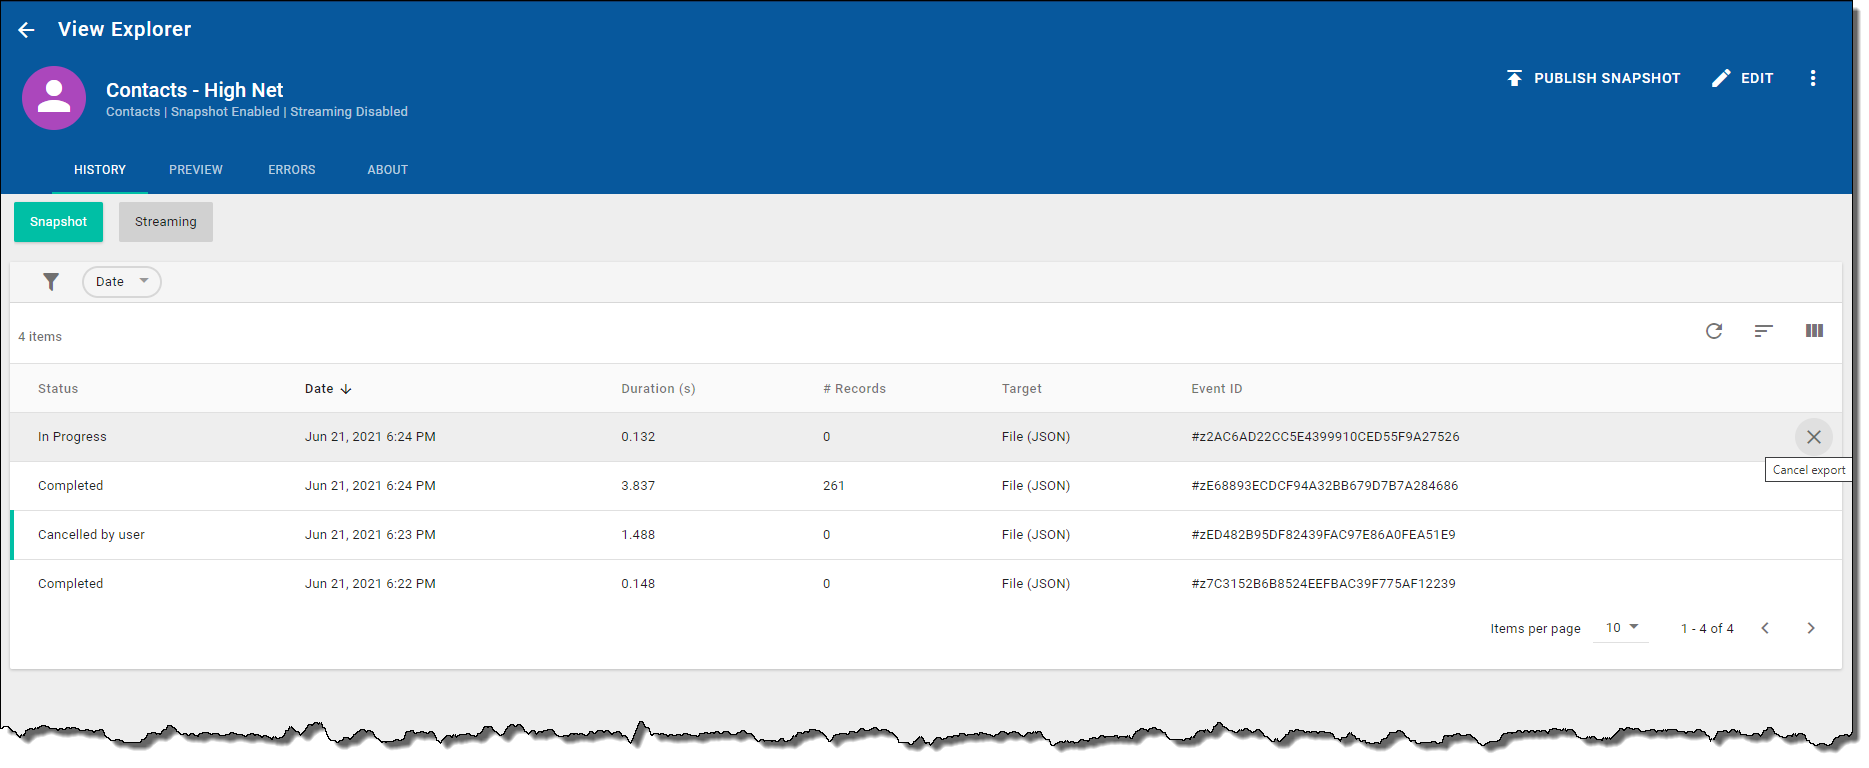
To cancel an "In Progress" or "In Progress with errors" snapshot, click the Cancel export button for the snapshot record. The following screenshot shows the Cancel export button:
The status for snapshot record will change immediately to "Cancelling" in the data table. The running process will complete publishing any records that were in progress and will not perform any additional work. After the export has completed, the status will change to "Cancelled by user."
For canceled exports, the currently processed records will still be exported (typically defined by the "Chunk Size").
Canceled snapshots do not block another snapshot export from being triggered.
If your snapshot has errors, click the Completed with errors link in the Status column to open the Errors dialog where you can further investigate the errors. For information about the data table columns used in the Errors dialog see, Error handling for snapshots and real-time streaming exports.
Reviewing the status and history for real-time streaming exports
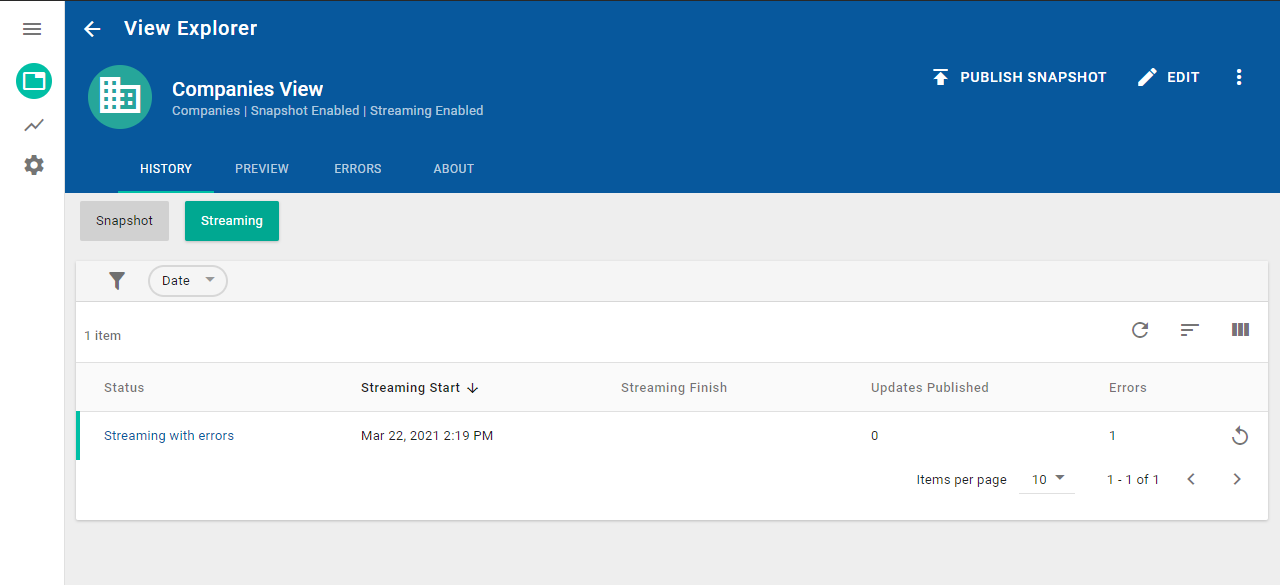
To review the status and history information for near real-time streaming exports, select the History tab and Streaming subtab for the view on the View Details page, which is shown in the following screenshot.
Each row in the streaming history data table represents a stream of data from NexJ CRM.
The streaming history data table contains the following columns:
Status - displays "Stopped" when you disable streaming by selecting Disable Streaming in the views data table, "Streaming" when you enable streaming by selecting Enable Streaming in the views data table, "Streaming with errors" if the streaming session is active and errors have occurred, or "Stopped with errors" if the streaming session has stopped (for example, streaming has been disabled) and errors have occurred.
There will be only one occurrence of "Streaming." All other rows will show "Stopped."- Streaming Start - displays the date and time when you enabled streaming for this view (you can sort the column in ascending or descending order by clicking the arrow button)
- Streaming Finish - displays the date and time when you disabled streaming for this view
- Updates Published - displays the number of changes from NexJ CRM that have been published for the view during a streaming period
- Errors - displays the number of exceptions that occurred when trying to connect to the publishing endpoint during a streaming period
If your snapshot has errors, click the Errors link in the Status column to open the Errors dialog where you can further investigate the errors. For information about the data table columns used in the Errors dialog see, Error handling for snapshots and real-time streaming exports.
Failed streaming updates can be retried (on a per-session basis) by clicking the Retry failed updates button. Failed updates can also be retried individually (on a per-message basis) in the Errors tab.
When a failed update is retried, the latest version of the relevant CRM data object will be published. Therefore it will not necessarily match the details of the original streaming update.
Error handling for snapshots and real-time streaming exports
To investigate whether your snapshot or real-time export for a view has errors, select the Errors tab for the view on the View Details page, which is shown in the following screenshot.
The errors data table contains the following columns:
- Date - the date when the error occurred
- Target - the publish target endpoint
- Event type - contains Streaming if the error occurred during a real-time export or Snapshot if the error occurred during a snapshot
Recovered - indicates the error recovery status for streaming errors only (Yes displays when the failed update was successfully retried)
Errors for the same set of change parameters (for example, class names, events, dirty attributes, bookmarks, and flags for deletions and context changes) are retried once and are all considered recovered after a successful retry of that change.
Recovery of snapshot export errors is currently not supported.
- Error - the error message
Event ID - a unique identifier to identify which snapshot or streaming export contains the error
Click on an Event ID value to filter the list of errors to only those that correspond to the same event.
- Instance ID - the ID of the CRM instance that was being updated
You can also select from the following filter chips and define search criteria to filter the errors data table:
- Date - Provide the date when the error occurred.
- Error Message - Select an operator and provide a value to filter for specific error messages.
- Event Type - Select Streaming or Snapshot for the publishing event type.
- Is Recovered - Select Yes or No based on whether the error has been resolved.
- Target - Select the File (JSON), File (Delimited), or Kafka publishing target.
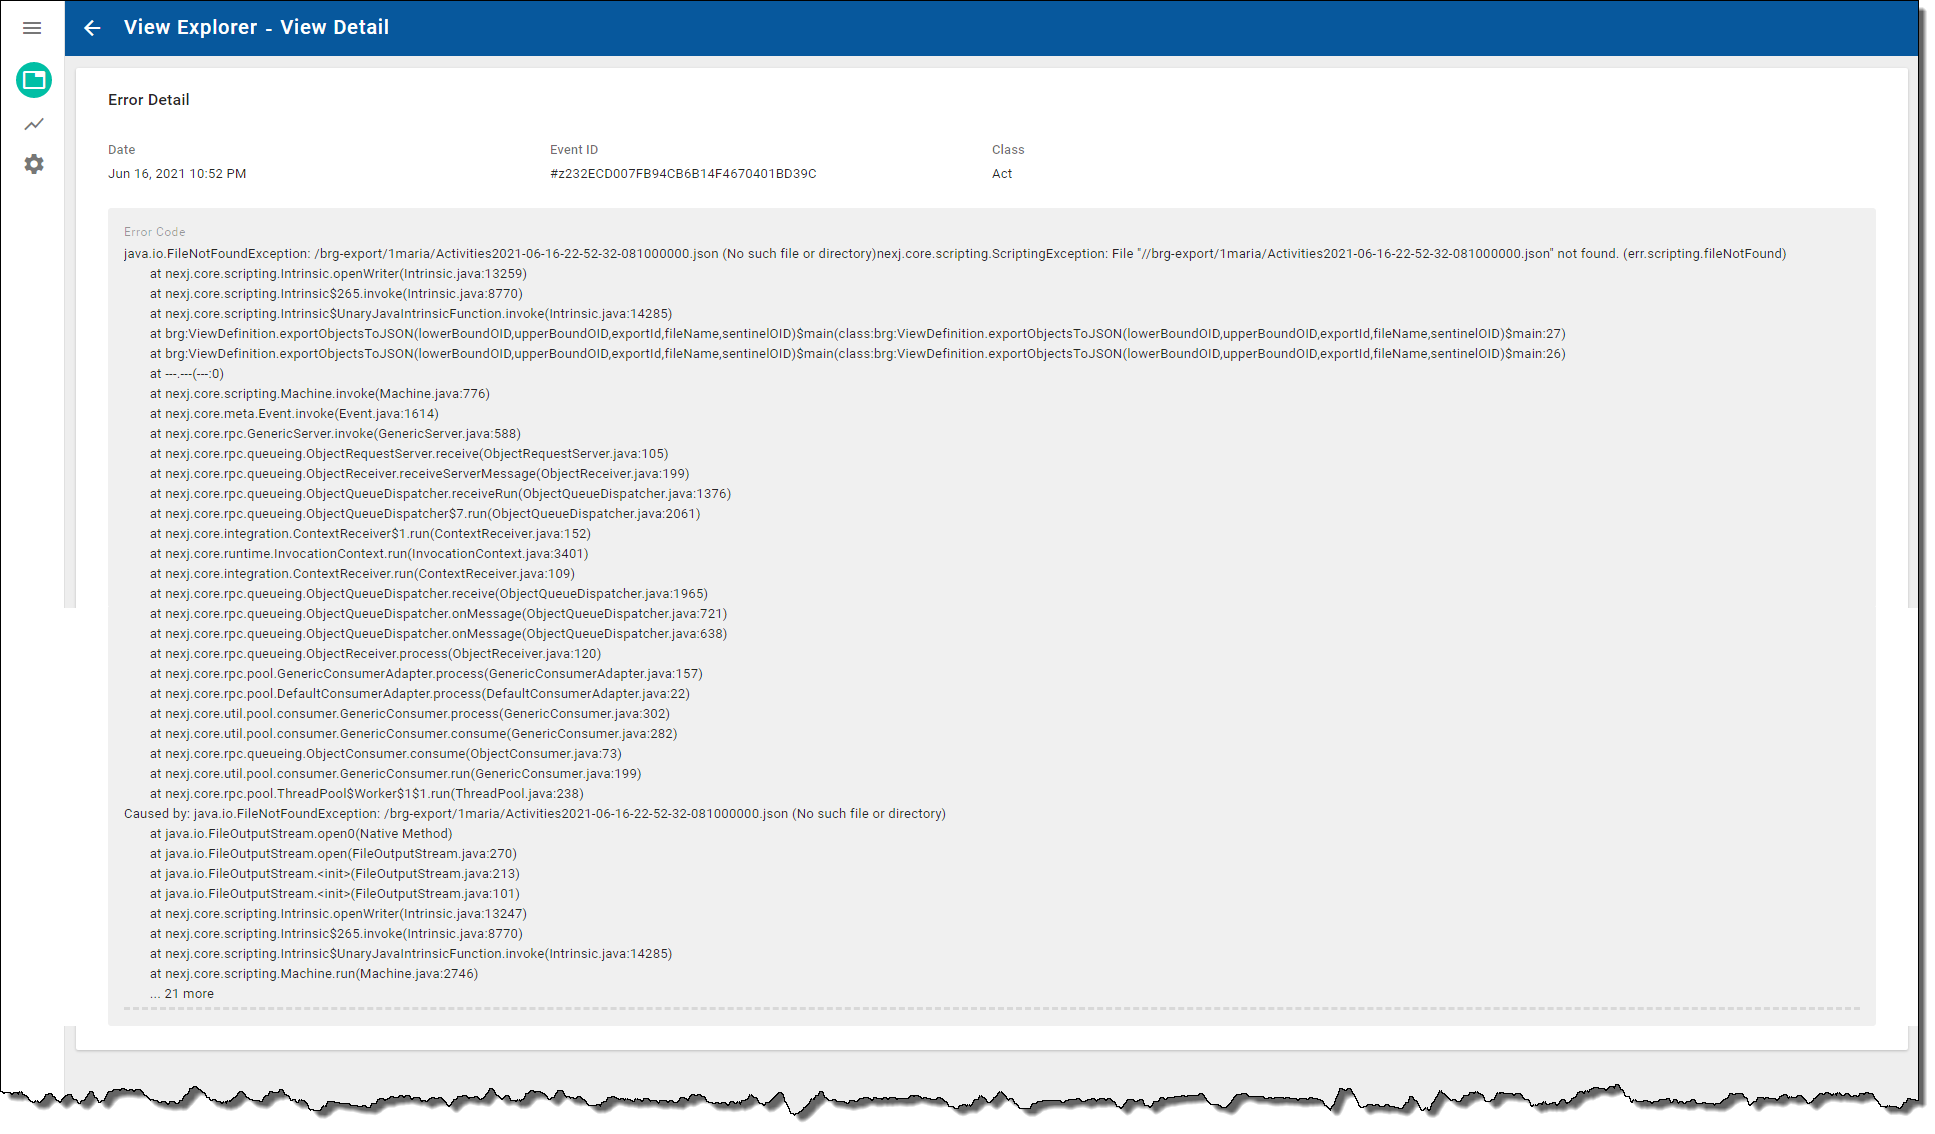
Double-click on errors in the data table to view the error details, which include the following information:
- Date - the date when the error occurred
- Event ID
- Class
- Error Code - the full error stack trace
The following screenshot shows an example:
Monitoring the performance of real-time streaming exports and snapshots
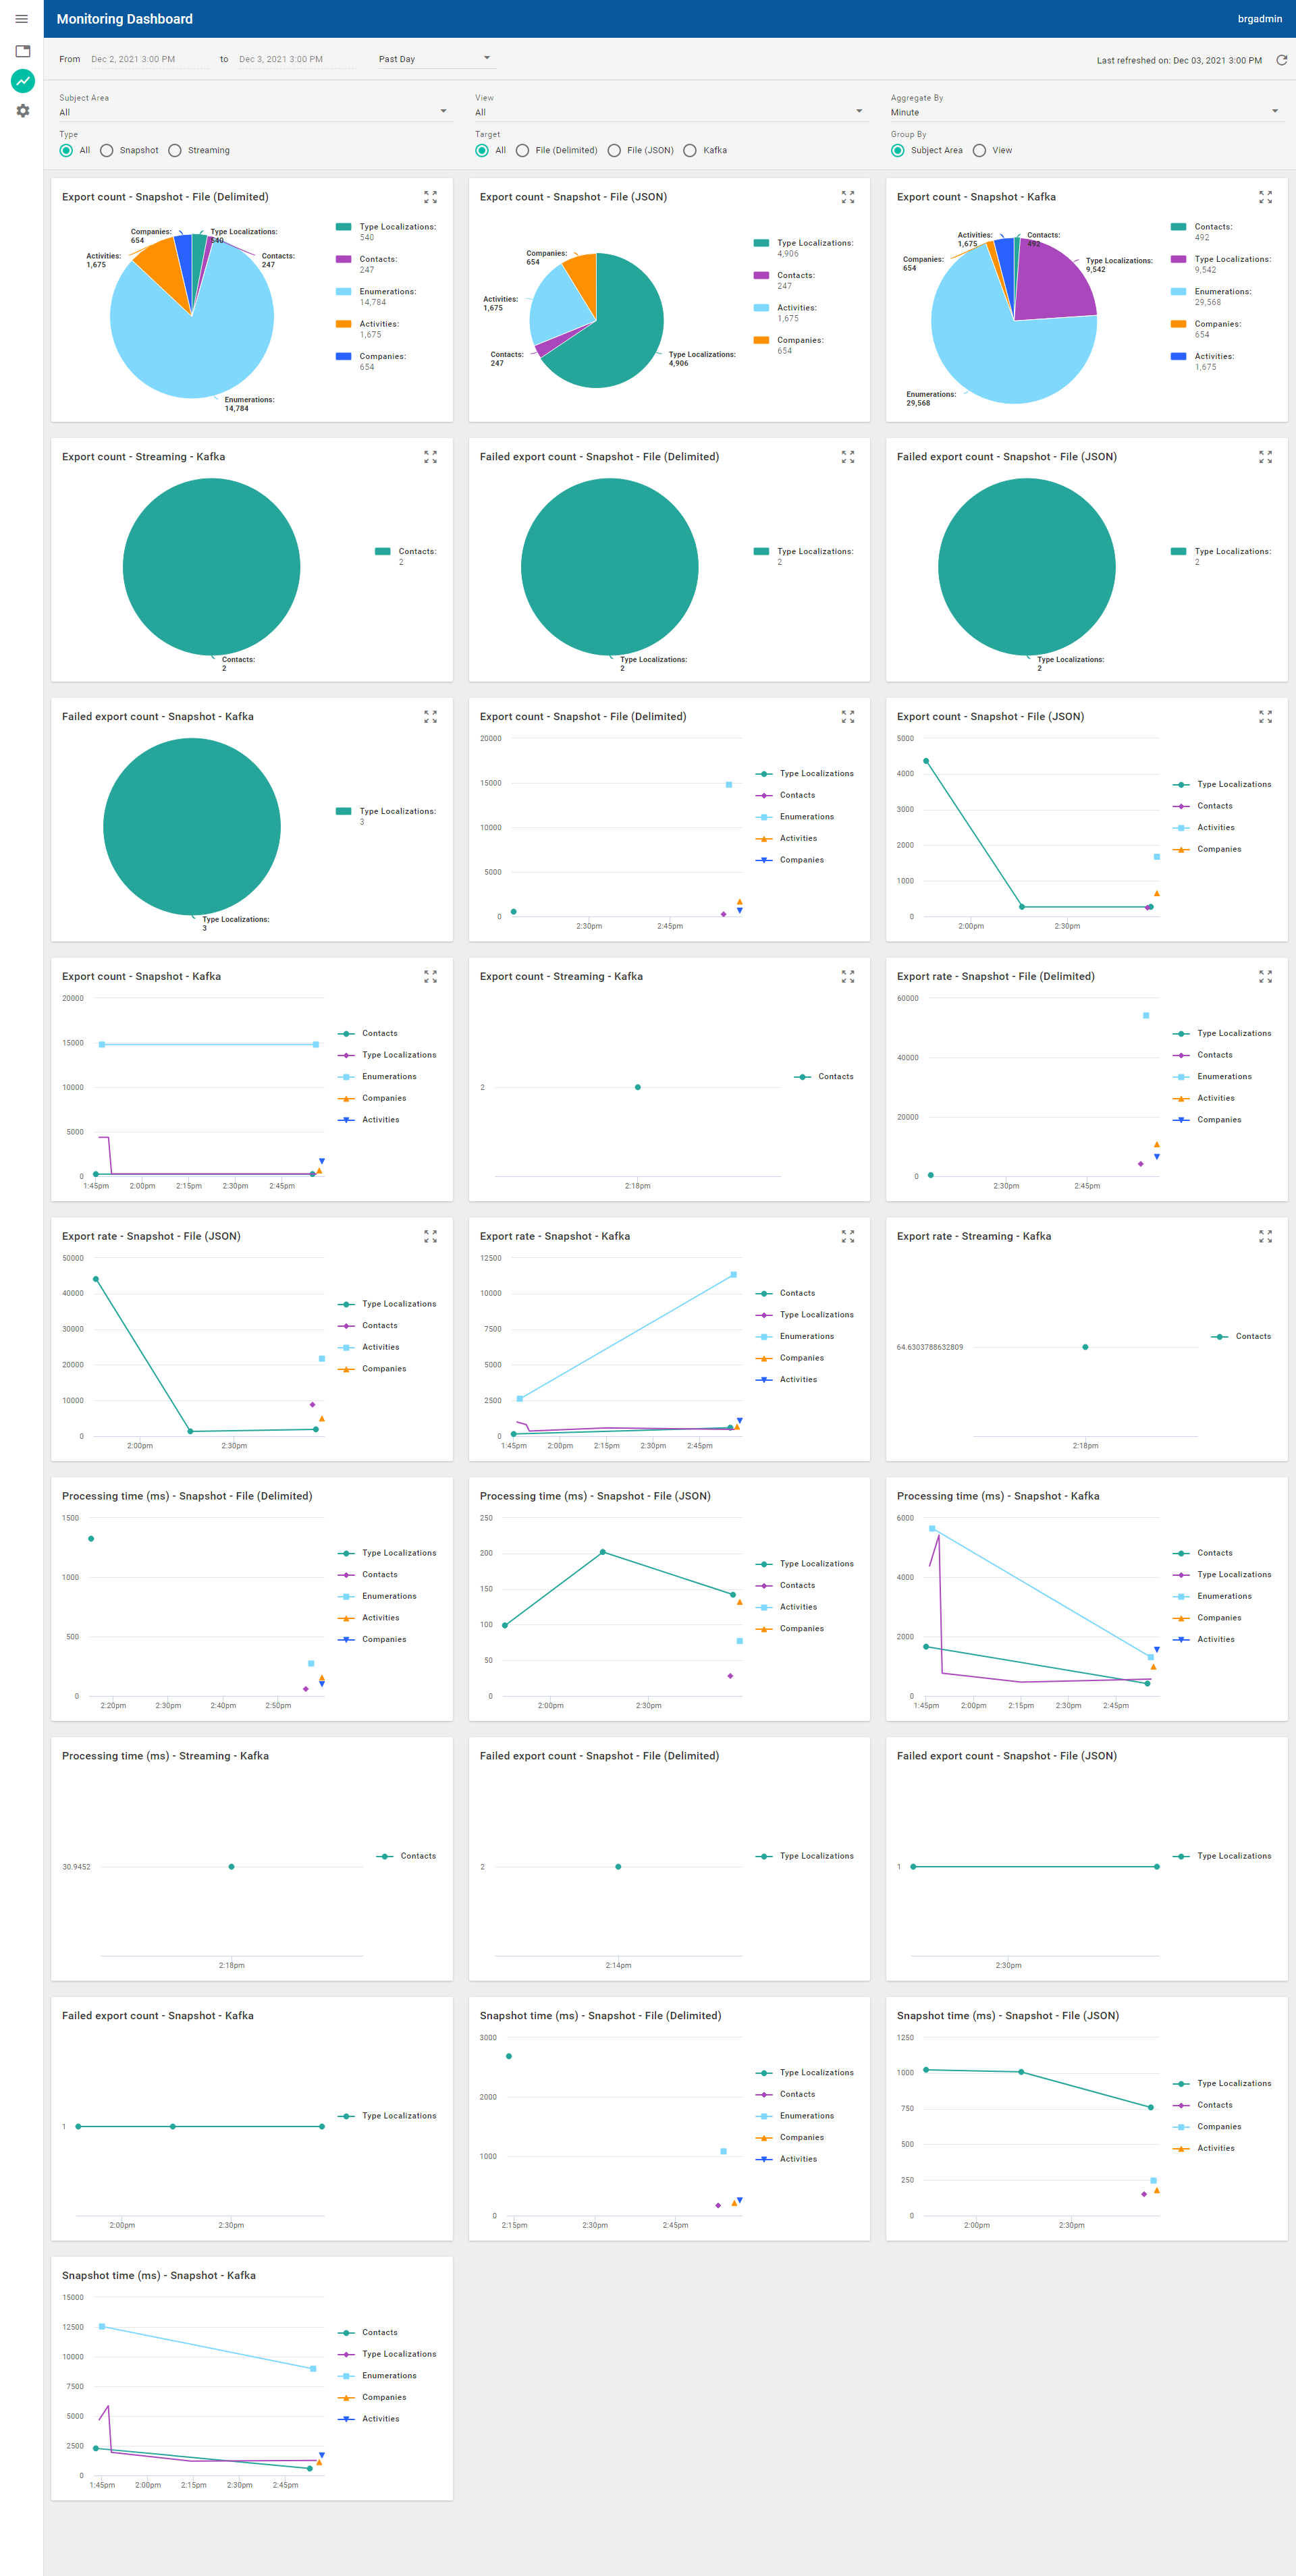
The Monitoring Dashboard enables you to view a high-level summary of streaming exports performance data and snapshots performance data on a single canvas. The following screenshot shows an example of the charts and graphs provided in the Monitoring Dashboard:
The brg:Stat database table is provided to store the statistics data that populates the performance Monitoring Dashboard. Being an indexed table, brg:Stat improves the speed at which the Monitoring Dashboard can aggregate statistics data.
Use the following filters to find the statistics that you would like to display as pie charts and time series graphs in the Monitoring Dashboard:
- From and To - Default to displaying statistics for the past 24 hours. The time range menu defaults to the past day. You can make a selection to change the time range. For example, you can select Past 1 Hour to just display statistics for the last hour for the current date.
- Subject Area - Defaults to All that displays statistics for all subject areas. You can select a subject area to display statistics for all views in the subject area.
- View - Defaults to All that display statistics for all views. You can select a view to only display statistics for the view.
- Aggregate By - Select the time interval used to aggregate the statistics. For example, select Minute, Hour, or Day.
- Type - Defaults to All to display statistics for all types of publishing (snapshot and real-time streaming). You can choose to display statistics for only one type by selecting Snapshot or Streaming.
- Target - Defaults to All to display statistics for all publishing endpoints. You can choose to display statistics for only one publishing endpoint by selecting File (Delimited), File (JSON), or Kafka.
- Group By - Defaults to Subject Area that groups the statistics data in charts and graphs by subject area. You can select View to group statistics by view.
The data displayed in the charts and graphs is automatically refreshed every minute. You can manully refresh the data by clicking the Refresh button.
The following charts and graphs are available:
You can hover over the charts or graphs to show details. You can also click on pie chart slices and graph data to display further information. The legends for charts and graphs display the subject areas or views that you have selected. Expand each chart or graph to a larger view format by clicking the Expand button .
| Charts and graphs | Description |
|---|---|
| Export count - Snapshot pie charts | The number of records that were published for the File (Delimited), File (JSON), or Kafka publishing endpoints for subject areas or views. |
| Export count - Snapshot graphs | The number of records that were published over time for the File (Delimited), File (JSON), or Kafka publishing endpoints. The y-axis shows the number of records while the x-axis shows the times when updates were published. |
| Export count - Streaming - Kafka pie chart | The number of records that were published for real-time streaming for subject areas or views for the Kafka publishing endpoint. |
| Export count - Streaming - Kafka graph | The number of records that were published for real-time streaming for the Kafka publishing endpoint. The y-axis shows the number of records while the x-axis shows the times when updates were published. |
| Export rate - Snapshot graphs | The processing rate for publishing records over time for the File (Delimited), File (JSON), or Kafka publishing endpoints. The y-axis shows the rate of updates published in Hertz while the x-axis shows the times when updates were published. |
| Export rate - Streaming - Kafka graph | The processing rate for publishing records over time for real-time streaming for the Kafka publishing endpoint. The y-axis shows the rate of updates published in Hertz while the x-axis shows the times when updates were published. |
| Failed export count - Snapshot pie charts | The numbers of records that were not published successfully for subject areas or views for the File (Delimited), File (JSON), or Kafka publishing endpoints. |
| Failed export count - Snapshot graphs | The number of records that were not published successfully over time for the File (Delimited), File (JSON), or Kafka publishing endpoints for subject areas or views. The y-axis shows the number of records while the x-axis shows the times when exports failed. |
| Processing time (ms) - Snapshot graphs | The total time (in ms) spent by all threads publishing data during a sampling period for the File (Delimited), File (JSON), or Kafka publishing endpoints. The y-axis shows the number of milliseconds it took to process the records while the x-axis shows the times when updates were published. |
| Processing time (ms) - Streaming - Kafka graph | The total time (in ms) spent by all threads publishing data during a sampling period during real-time streaming for the Kafka publishing endpoint. The y-axis shows the number of milliseconds it took to process the records while the x-axis shows the times when updates were published. |
| Snapshot time (ms) - Snapshot graphs | The time it took to publish snapshots for the File (Delimited), File (JSON), or Kafka publishing endpoints. The y-axis shows the number of milliseconds it took for the snapshots to publish while the x-axis shows the times when snapshots were published. |
Using the Global Settings workspace
You can use the Global Settings workspace to:
- Review CRM connection information, file export information settings, and Kafka server settings that were configured during deployment.
- Import CRM metadata (for example, new subject areas) and Data Bridge configuration at run time on the Dynamic Metadata Loading card and view the current list of loaded metaclasses on the Loaded Subject Areas card.
- Export CRM metadata as JSON using the CRM Data Bridge Adapter Admin card.
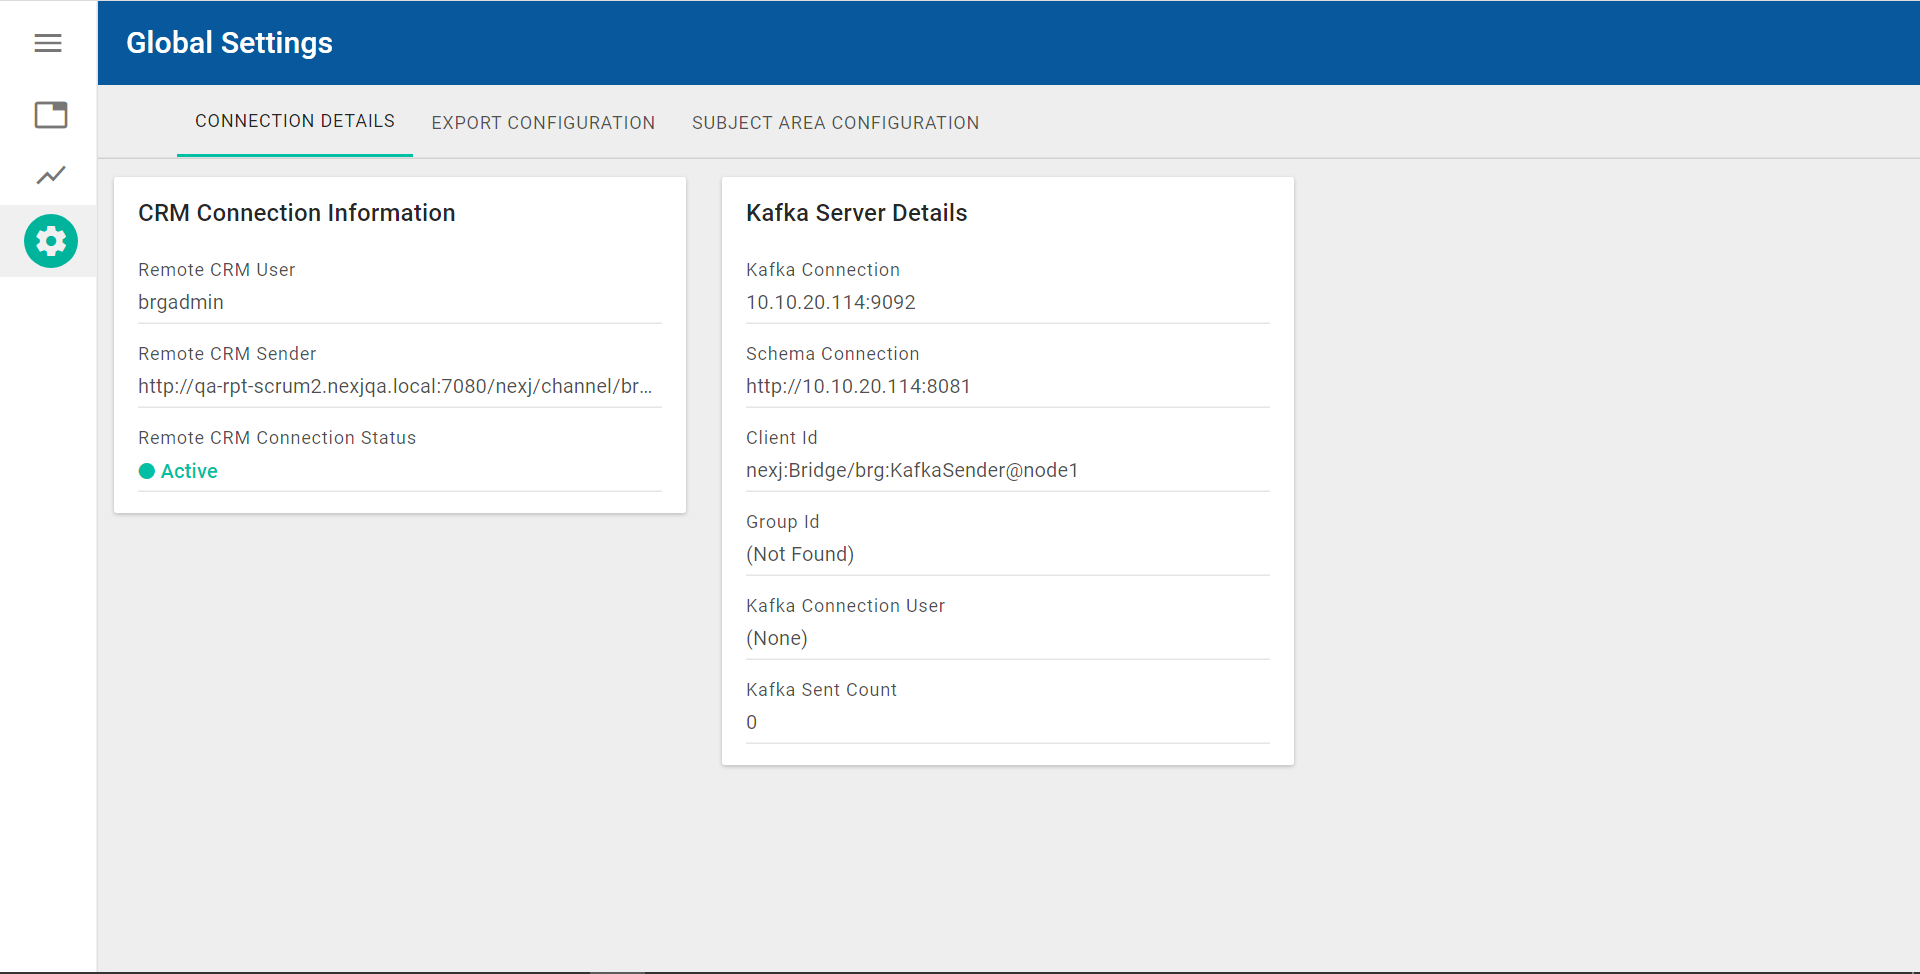
The following snapshot shows the Global Settings workspace:
Configure settings on the Global Settings workspace in the following tabs and cards:
- Connection Details tab:
- CRM Connection Information card contains the following fields:
Remote CRM User – Displays the login ID used by Data Bridge to connect with NexJ CRM. This is configured in your Data Bridge environment file during deployment.
Remote CRM Sender – Displays the URL for the brg:CRMSender channel, which is the URL used by Data Bridge to integrate with a NexJ CRM cluster. This channel setting is configured in your Data Bridge environment file during deployment.
Remote CRM Connection Status – Displays Active when the integration call with NexJ CRM is connected and Inactive when Data Bridge is unable to connect to NexJ CRM.
- Kafka Server Details card contains the following fields:
- Kafka Connection - Displays the address for your Kafka server.
- Schema Connection - Displays the URL for your Schema connection.
- Client Id - Displays the client ID that is used to connect to your Kafka server.
- Group Id - Displays the group ID that is used to connect to your Kafka server.
- Kafka Connection User - Displays the user name for your Kafka server.
- Kafka Sent Count - Displays the number of messages that have been sent by your Kafka server.
- CRM Connection Information card contains the following fields:
- Export Configuration tab:
The File Export Configuration card contains the following fields:
The initial default values for the settings in the File Export Configuration card and Delimited File Format Configuration cards can be defined in the environment file.
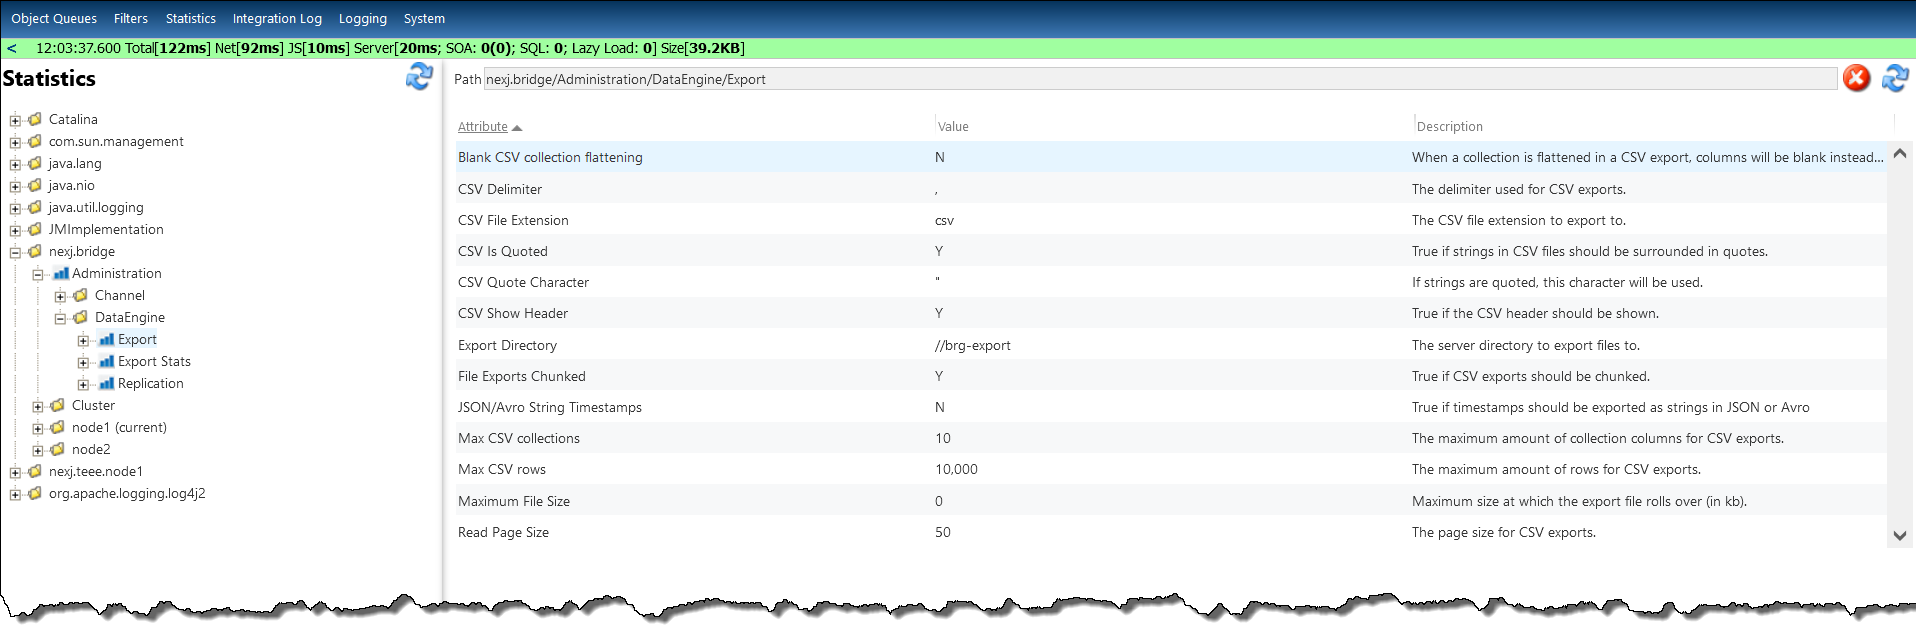
These settings can also be configured in the Statistics tab in the Data Bridge System Admin Console at https://[host]/nexj/SysAdmin.html by selecting nexj.bridge > Administration > DataEngine > Export to expand the notes in the tree, and entering the required settings.
If you change these settings at run time using the File Export Configuration card and Delimited File Format Configuration card fields, your settings will override the settings in the environment file and Data Bridge System Admin Console.
- Export Path - Enter the default path of the output directory for exported files. This setting can be initially configured in your Data Bridge environment file during deployment using the
meta.bridge.exportDirectoryproperty. You can also configure it using the CSV Export Directory setting in the Data Bridge System Admin Console. - Read Page Size - Enter the maximum number of NexJ CRM records that can be read in a single query from NexJ CRM. This attribute also controls the maximum number of records per file in the chunked mode. This setting can be initially configured in your Data Bridge environment file during deployment using the
meta.bridge.pageSizeproperty. You can also configure it using the Read Page Size setting in the Data Bridge System Admin Console. Maximum File Size - Enter the maximum threshold in kilobytes when the export will roll over into additional files. If you enter 0, a single file will be created for each export.
- Export Path - Enter the default path of the output directory for exported files. This setting can be initially configured in your Data Bridge environment file during deployment using the
- For information about the fields in the Delimited File Format Configuration card, see Output format specifications.
- The JSON/Avro Format Configuration card contains the following field:
Timestamp Attribute Formatting - By default, timestamp attributes are formatting as
longintegers, and Numeric is selected. To format them as strings, click String.
- Subject Area Configuration tab:
- For information about the Dynamic Metadata Loading and Loaded Subject Areas cards, see Loading model changes at run time.
- If you want to export CRM metadata as JSON, click the "To Export Metadata from CRM" link and log in using your NexJ CRM user name and password. The Classes to export list that displays shows the filter chips that represent the default metaclasses that will be exported by default.
- You can choose to:
- Add new metaclass names to the export list. You can add:
- A single metaclass to the list by entering the class name in the Add class names to the export list (new line separated) field.
- Multiple metaclass names to the list by opening a text editor, entering the class names separated by new line "\n" characters, and copying and pasting this information into the Add class names to the export list (new line separated) field.
Add the class names to the Classes to export list as filter chips, by clicking Add Class Names To Export List.
- Disable the export of metaclasses in the Classes to export list by clicking the icon for filter chips.
- Re-enable the export of metaclasses that you have disabled, by clicking the Select button to open the Classes to export dialog where you can re-select classes for export.
- Clear the Classes to export list by selecting the Clear button .
- Add new metaclass names to the export list. You can add:
- In the Specify a location on the application server to export metadata field, provide the name of the application server directory that will contain the exported .json files.
- To perform the export, click Export CRM Metadata. The Exported classes to JSON on the application server file system dialog displays all the metaclasses that will be exported. To proceed with the export, click Got it. The .json files for the metaclasses are created in the directory you specified in step 2.
- You can choose to:


