Interpreting performance statistics for NexJ CRM
Performance statistics display request and response metrics for the user, providing detailed information on browser-to-server requests in real time.
Use this functionality to identify network and environment issues in your application deployment. This helps application developers and quality assurance analysts understand potential performance bottlenecks, detect performance regressions, and investigate environment issues such as database performance.
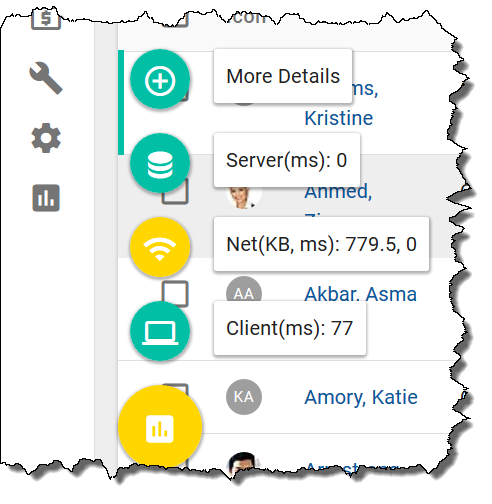
As of NexJ CRM 9.4, application developers, solution architects, or QA analysts, can click the Show available actions floating action button in the bottom-left corner of the user interface to display the summary of server, network, and client performance statistics.
The following screenshot shows the floating action button and the available statistics:

The value displayed in each property label is the maximum value of the last 10 summarized entry values for that property.
The numbers displayed on the labels are rounded to the nearest integer above them, however for numbers less than 10 the values display one decimal digit.
If the user is curious to know more details about the performance statistics for each event, the user can click More Details to open the Performance statistics dialog that contains further details. The Performance statistics dialog contains the following information.
Metric | Definition |
|---|---|
| Event | The event or user action that occurred. |
| Path | The path to the target view of the event, if available. |
| Request Type | The type of resource that was requested for the event. |
| Start time (ms) | The time at which processing of the event is started. |
End time (ms) | The time at which processing of the event is ended. |
Lazy load (#) | The number of lazy loads the server did while handling the request. |
RPC (#) | The number of remote procedure calls to the server while handling the event. |
SQL (#) | The number of SQL queries the server made while handling the request. |
Server (ms) | The time it took for the server to handle the request in milliseconds. |
SOA (#) | The number of SOA calls made to the server. |
SOA depth | The maximum call depth reached by any single SOA call. |
Response (KB) | The size of the body of the response in KB. |
Network (ms) | The network processing time in milliseconds. |
Update cycles (#) | The number of times the application went through retrieving and rendering the information while handling the event. |
Render (ms) | The time it took to render the information in the browser while handling the event. |
Browser (ms) | The processing time of the event in the browser while handling the event. |
Total (ms) | The sum of the network, server, and browser execution time in milliseconds. |
Metrics
The following metrics are displayed in the floating action button:
Server(ms)
The time it took for the server to handle the request in milliseconds.
Net(KB)
The size of the body of the response in KB.
Net(ms)
The network processing time in milliseconds.
Client(ms)
The time the browser took to process the response in milliseconds.
Color coding
The following default threshold values determine the color of the statistics icons.
Threshold values
| Property | Yellow threshold | Red threshold |
|---|---|---|
| NetData (KB) | 700 | 1575 |
| NetTime (ms) | 250 | 450 |
| Server (ms) | 500 | 850 |
| Client (ms) | 1000 | 1750 |
| Total (ms) | 1500 | 2500 |
