
Monitoring the performance of real-time streaming exports and snapshots
The Monitoring Dashboard workspace ![]() enables you to view a high-level summary of streaming exports performance data and snapshots performance data on a single canvas. The following screenshot shows an example of the charts and graphs provided in the Monitoring Dashboard:
enables you to view a high-level summary of streaming exports performance data and snapshots performance data on a single canvas. The following screenshot shows an example of the charts and graphs provided in the Monitoring Dashboard:
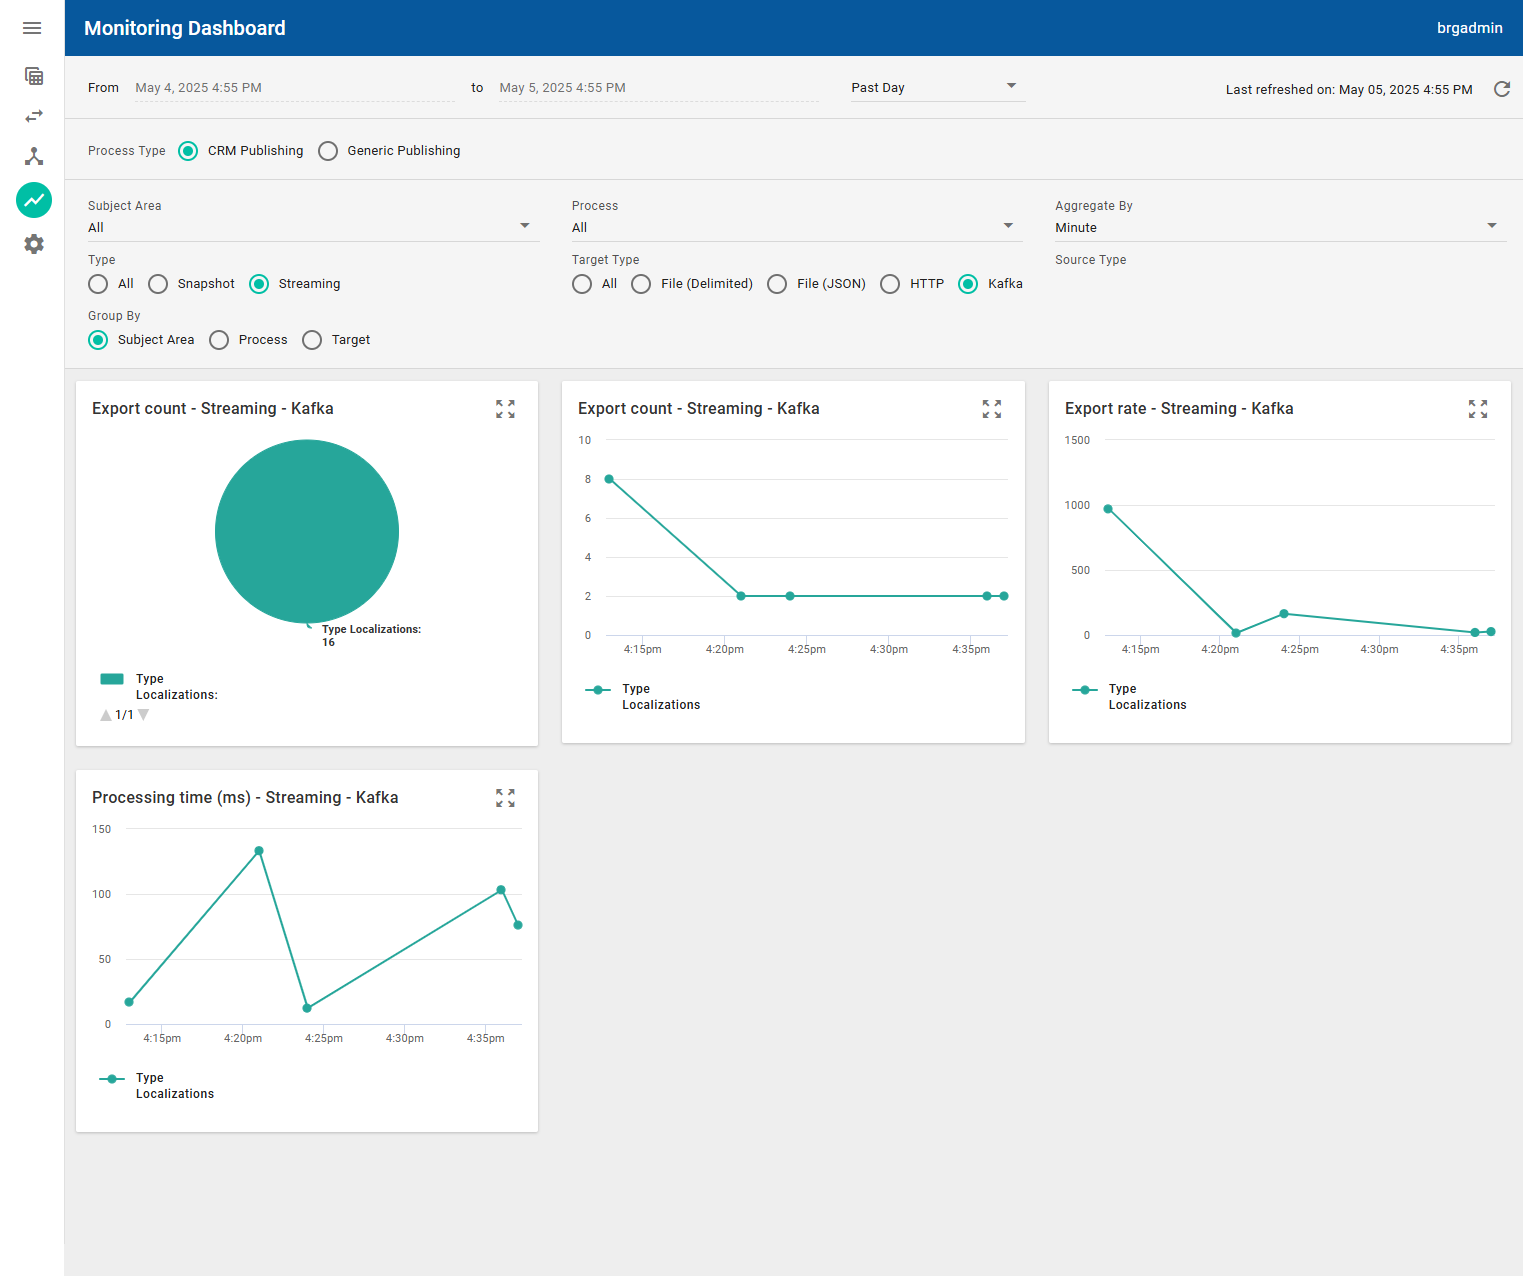
Use the following filters to find the statistics that you would like to display as pie charts and time series graphs in the Monitoring Dashboard:
Filter Fields | Description |
|---|---|
From and To, and time range selection | By default, statistics are displayed for the past 24 hours. The time range menu defaults to the past day. You can make a selection to change the time range. For example, you can select Past 1 Hour to just display statistics for the last hour for the current date. Ensure that there is a value in the Select a Time Range field in order to specify values in the From and To fields. |
Process Type | Select CRM Publishing or Generic Publishing. |
Subject Area | By default, All is selected to indicated that statistics are displayed for all subject areas. You can select a subject area to display statistics for all processes in that subject area. |
Process | By default, All is selected to indicate that statistics are displayed for all processes. If a subject area is selected, only the statistics for the processes in that subject area are displayed. You can select a process name to only display statistics for that process. |
Aggregate By | Select the time interval used to aggregate the statistics. For example, select Minute, Hour, or Day. |
Type | For CRM publishing processes, select All to display statistics for both snapshot and real-time streaming. You can choose to display statistics for only one type by selecting Snapshot or Streaming. |
Target Type | For CRM publishing processes, select All to display statistics for all publishing target types. You can choose to display statistics for only one publishing target type by selecting a publishing target type, such as File (JSON) or Kafka. |
Source Type | For generic publishing processes, indicates the source of the data. Currently, only Kafka topics are supported. |
Group By | By default, statistics data in charts and graphs is grouped by Subject Area. You can select Process or Target to group statistics by process or publishing target. |
The data displayed in the charts and graphs is automatically refreshed every minute. You can manually refresh the data by clicking the Refresh button
The following charts and graphs are available.
You can hover over the charts or graphs to show details. You can also click on pie chart slices and graph data to display further information. The legends for charts and graphs display the subject areas or processes that you have selected. Expand each chart or graph to a larger view format by clicking the Expand button 
Charts and graphs | Description |
|---|---|
Export count - Snapshot pie charts | The number of records that were published for the File (Delimited), File (JSON), HTTP, or Kafka publishing targets for subject areas or processes. |
Export count - Snapshot graphs | The number of records that were published over time for the File (Delimited), File (JSON), HTTP, or Kafka publishing targets. The y-axis shows the number of records while the x-axis shows the times when updates were published. |
Export count - Streaming - Kafka pie chart | The number of records that were published for real-time streaming for subject areas or processes for the Kafka publishing target. |
Export count - Streaming - Kafka graph | The number of records that were published for real-time streaming for the Kafka publishing target. The y-axis shows the number of records while the x-axis shows the times when updates were published. |
Export rate - Snapshot graphs | The processing rate for publishing records over time for the File (Delimited), File (JSON), HTTP, or Kafka publishing targets. The y-axis shows the rate of updates published in Hertz while the x-axis shows the times when updates were published. |
Export rate - Streaming - Kafka graph | The processing rate for publishing records over time for real-time streaming for the Kafka publishing target. The y-axis shows the rate of updates published in Hertz while the x-axis shows the times when updates were published. |
Failed export count - Snapshot pie charts | The numbers of records that were not published successfully for subject areas or processes for the File (Delimited), File (JSON), HTTP, or Kafka publishing targets. |
Failed export count - Snapshot graphs | The number of records that were not published successfully over time for the File (Delimited), File (JSON), HTTP, or Kafka publishing targets for subject areas or processes. The y-axis shows the number of records while the x-axis shows the times when exports failed. |
Processing time (ms) - Snapshot graphs | The total time (in ms) spent by all threads publishing data during a sampling period for the File (Delimited), File (JSON), HTTP, or Kafka publishing targets. The y-axis shows the number of milliseconds it took to process the records while the x-axis shows the times when updates were published. |
Processing time (ms) - Streaming - Kafka graph | The total time (in ms) spent by all threads publishing data during a sampling period during real-time streaming for the Kafka publishing target. The y-axis shows the number of milliseconds it took to process the records while the x-axis shows the times when updates were published. |
Snapshot time (ms) - Snapshot graphs | The time it took to publish snapshots for the File (Delimited), File (JSON), HTTP, or Kafka publishing targets. The y-axis shows the number of milliseconds it took for the snapshots to publish while the x-axis shows the times when snapshots were published. |
The brg:Stat database table is provided to store the statistics data that populates the performance Monitoring Dashboard. Being an indexed table, brg:Stat improves the speed at which the Monitoring Dashboard can aggregate statistics data.