
Navigating the Data Bridge user interface
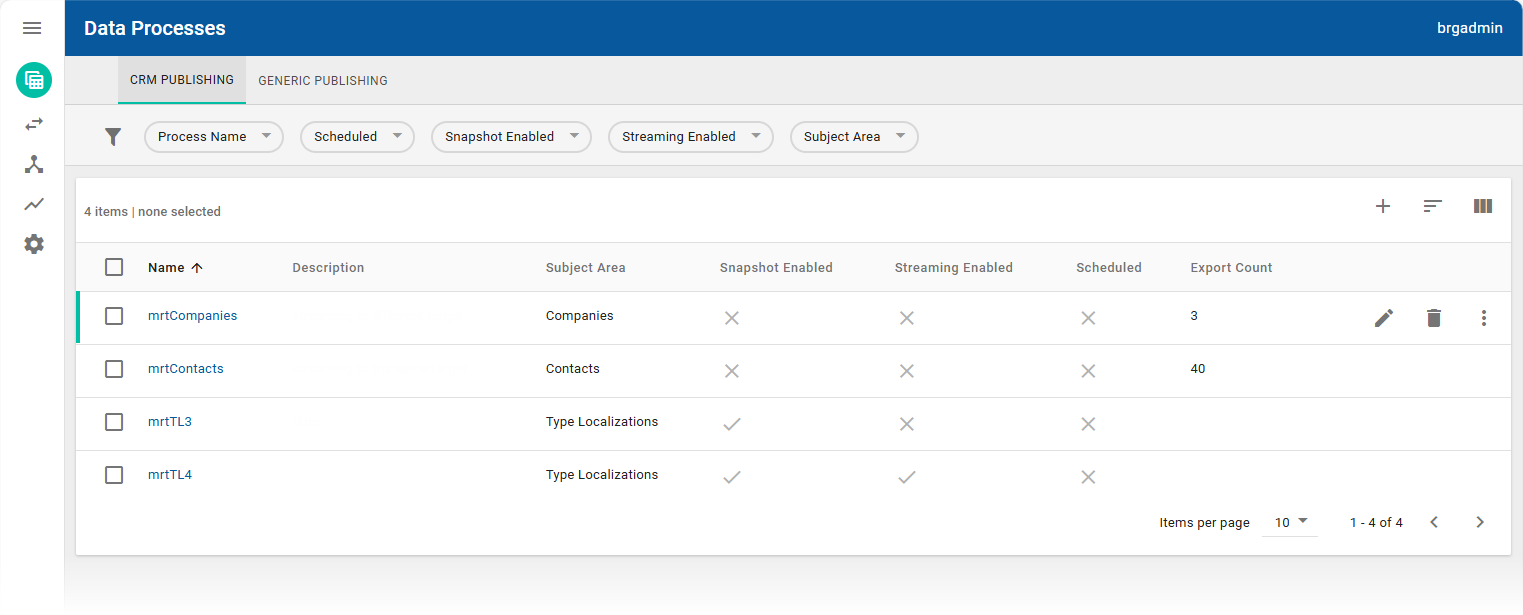
The following screenshot shows the main application window for Data Bridge, which consists of a navigator sidebar on the left side and a workspace area in the center.
The navigator sidebar enables you to navigate to the different workspaces. To expand the sidebar menu, and see the names of the workspaces, click the Open navigator button ![]() at the top of the sidebar. Click the Close navigator button
at the top of the sidebar. Click the Close navigator button ![]() to collapse the sidebar.
to collapse the sidebar.
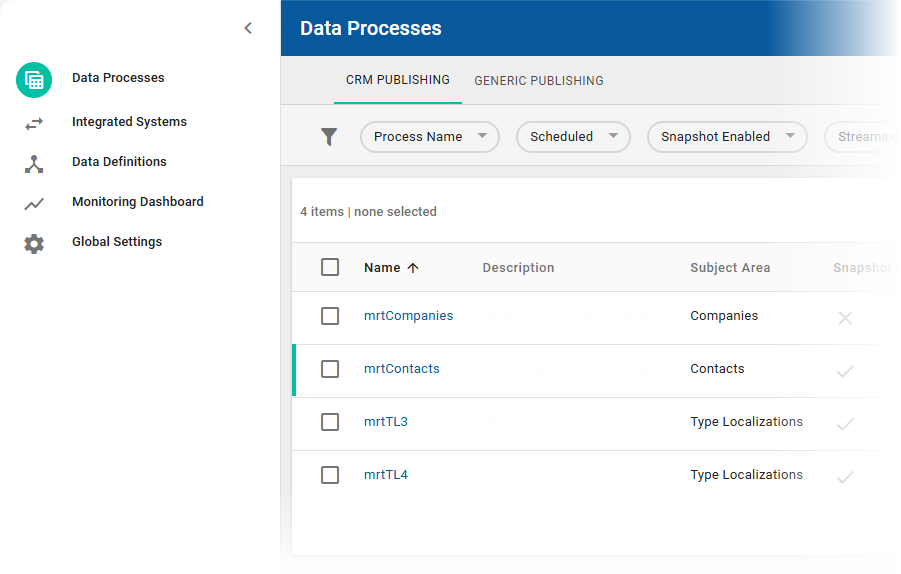
Click directly on a workspace icon or name to navigate to that workspace.
NexJ Data Bridge provides the following workspaces.
Workspace Icon | Workspace Name | Workspace Description |
|---|---|---|
| Data Processes | The Data Processes workspace is where you create, view, and manage CRM and generic data publishing processes, including publishing snapshots of CRM data or streaming updates to various targets (files, HTTP, Kafka). |
| Integrated Systems | The Integrated Systems workspace is where you configure and manage data source connections and publishing targets for exporting and ingesting data. The Publishing Targets tab lets you add, edit, import, export, and delete publishing endpoints such as files, HTTP URLs, or Kafka topics for your data processes. The Data Sources tab is used to set up and manage Kafka topic subscriptions, enabling Data Bridge to ingest external data streams for integration with CRM or third-party APIs. |
| Data Definitions | The Data Definitions workspace enables users to define and manage schemas and transformation rules for both data publishing and data ingestion, supporting complex data orchestration tasks between NexJ CRM and other systems in organization-specific formats. Transformations can be applied to processes using configurable functions, allowing precise mapping and calculation logic for messages as data moves between source and target schemas. For more information, see Defining transformations for data publishing . |
| Monitoring Dashboard | The Monitoring Dashboard workspace enables you to view a high-level summary of streaming exports performance data and snapshots performance data on a single canvas. For more information, see Monitoring the performance of real-time streaming exports and snapshots . |
| Global Settings | You can use the Global Settings workspace to:
For more information, see Using the Global Settings workspace . |
Working with data tables
Most workspaces, including the Data Processes workspace, Integrated Systems workspace, and Data Definitions workspace, contain a data table displaying information related to that workspace. Data table functionality may depend on the specific workspace and your access, but usually allows users to perform multiple actions, either from the table toolbar or from the individual table row.
Where there are more than three buttons displayed on the table toolbar or the table row, additional actions may be accessed from the More Actions button ![]() menu.
menu.
You can perform the following actions from the data table toolbar:
Click the Add… button
 in the data table toolbar to create a new record. For example, click Add Process on the Data Processes workspace to create a new data process or click Add Target on the Integrated Systems workspace to create a new publishing target.
Sort records in the data table in ascending or descending order. When you hover over a header of a column that can be used to sort the records, an arrow displays beside the column header. To sort the records in the data table by a sortable column, click the column header. A sorted column displays an up or down arrow beside the header to indicate the sort order. To reverse the sort order, click the column header again. You can also click the Sort by button
 in the data table toolbar and select a column to sort the displayed results.
Click the Select columns button
 in the data table toolbar to choose the columns to display in the data table.
On the Integrated Systems workspace, the Publishing Targets tab data table also allows you to import existing target definitions by clicking the Import Target button
 .
.
Hover over a row in the data table to reveal action buttons to:
Edit the record by clicking the Edit… button
 .
.Delete the record by clicking the Delete… button
 .
.Perform additional actions that are specific to a tab and workspace, for example, you can publish a snapshot from the CRM Publishing tab of the Data Processes workspace by selecting Publish Snapshot, and then selecting a snapshot-enabled publishing target.
Use the Items per page drop-down to limit the number of items displayed per page.
Use the chevron buttons

 to navigate between pages to display additional records.
To delete multiple records or all records at once, you can enable the checkbox for each record or enable the Select all checkbox beside the Name column. This changes the table toolbar to display the Delete … button. Click the button to delete all the selected records.